29
/
en
AIzaSyAYiBZKx7MnpbEhh9jyipgxe19OcubqV5w
April 1, 2024
194521
Mauritius
MUS
true
2
1
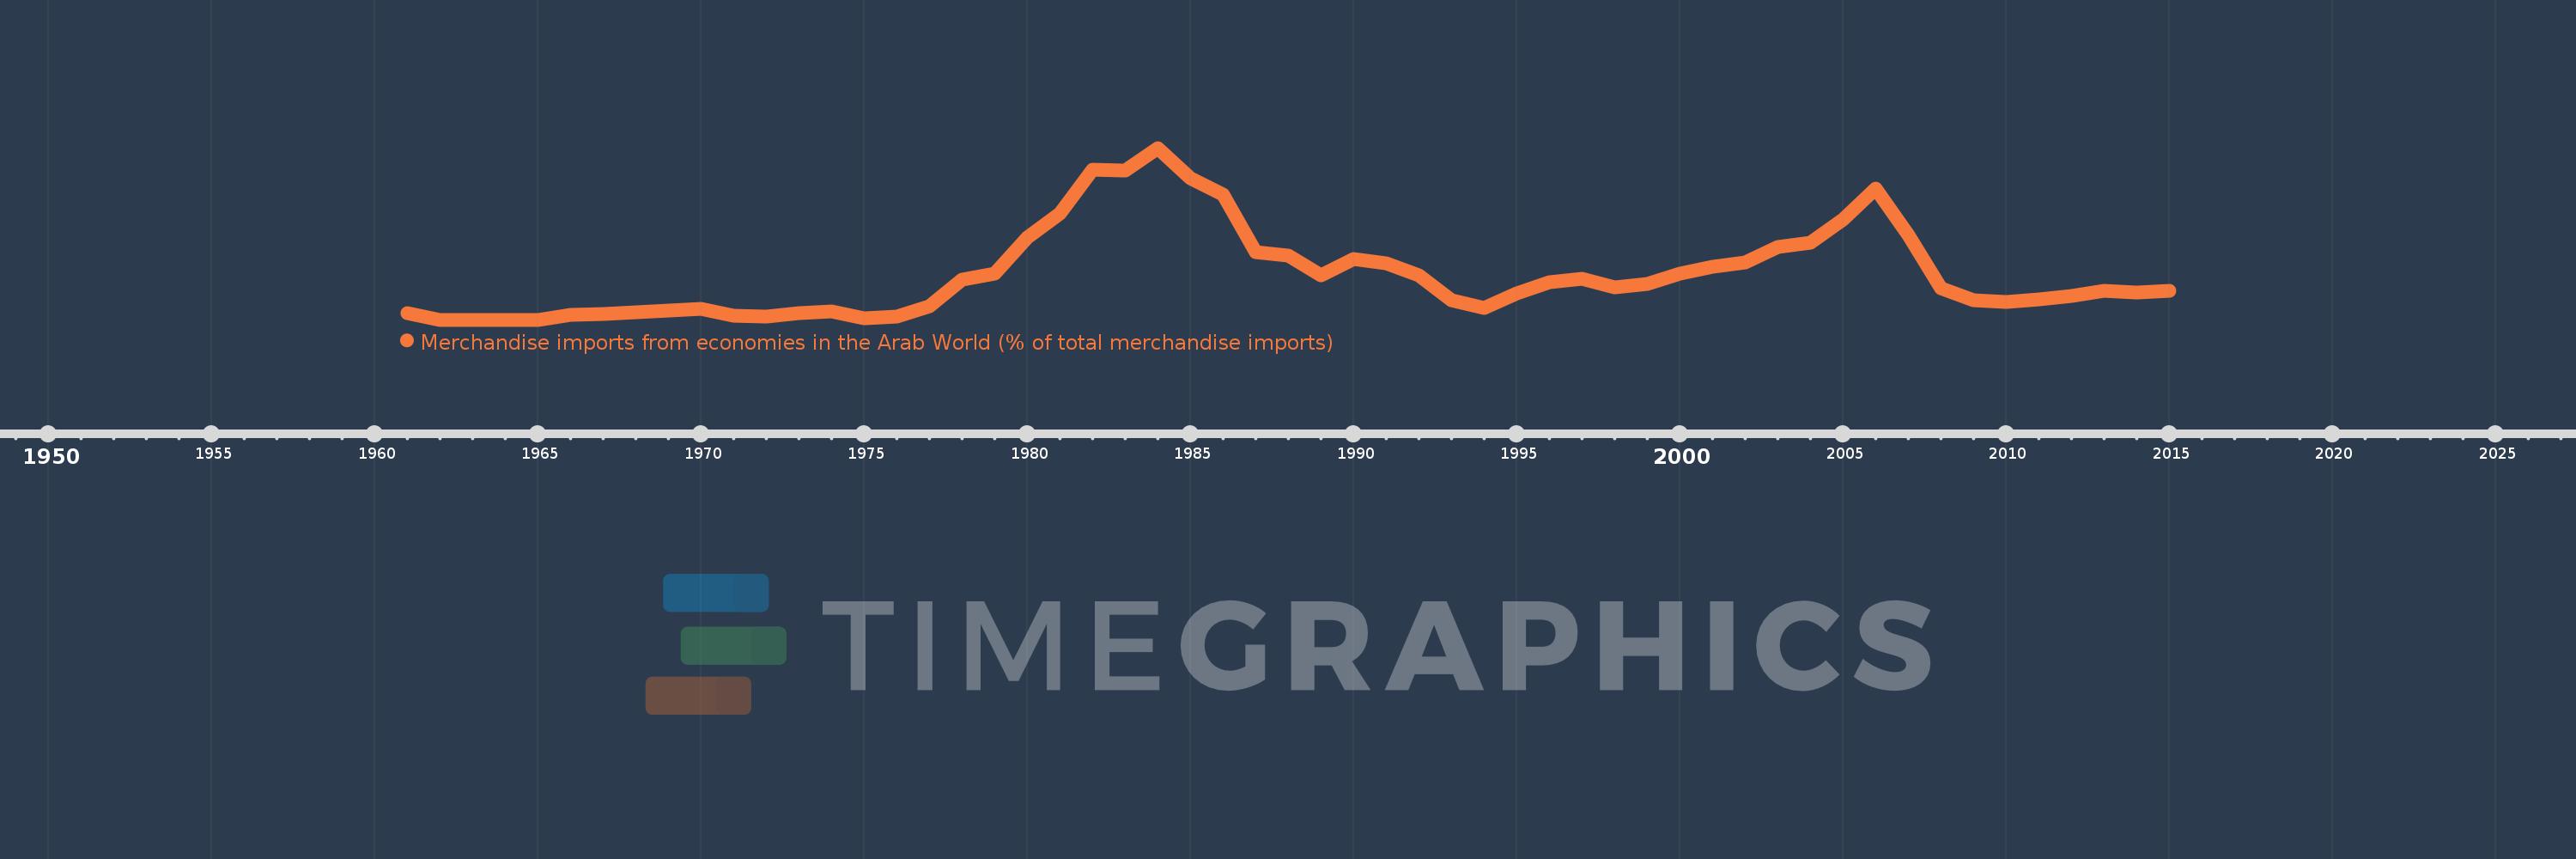
Merchandise imports from economies in the Arab World (% of total merchandise imports)
2015,2014,2013,2012,2011,2010,2009,2008,2007,2006,2005,2004,2003,2002,2001,2000,1999,1998,1997,1996,1995,1994,1993,1992,1991,1990,1989,1988,1987,1986,1985,1984,1983,1982,1981,1980,1979,1978,1977,1976,1975,1974,1973,1972,1971,1970,1969,1967,1966,1965,1964,1963,1962,1961
This statistics in other country:
AfghanistanAlbaniaAlgeriaAngolaArab WorldArgentinaArmeniaArubaAustraliaAustriaAzerbaijanBahamas, TheBahrainBangladeshBarbadosBelarusBelgiumBelizeBeninBermudaBoliviaBrazilBrunei DarussalamBulgariaBurkina FasoBurundiCabo VerdeCambodiaCameroonCanadaCaribbean small statesCentral African RepublicCentral Europe and the BalticsChadChileChinaColombiaComorosCongo, Dem. Rep.Congo, Rep.Costa RicaCote d'IvoireCroatiaCubaCyprusCzech RepublicDenmarkDjiboutiDominicaDominican RepublicEarly-demographic dividendEast Asia & PacificEast Asia & Pacific (excluding high income)East Asia & Pacific (IDA & IBRD countries)EcuadorEgypt, Arab Rep.El SalvadorEstoniaEthiopiaEuro areaEurope & Central AsiaEurope & Central Asia (excluding high income)Europe & Central Asia (IDA & IBRD countries)European UnionFijiFinlandFragile and conflict affected situationsFranceFrench PolynesiaGabonGambia, TheGeorgiaGermanyGhanaGreeceGreenlandGrenadaGuatemalaGuineaGuinea-BissauGuyanaHaitiHeavily indebted poor countries (HIPC)High incomeHondurasHong Kong SAR, ChinaHungaryIBRD onlyIcelandIDA & IBRD totalIDA blendIDA onlyIDA totalIndiaIndonesiaIran, Islamic Rep.IraqIrelandItalyJamaicaJapanJordanKazakhstanKenyaKorea, Dem. People’s Rep.Korea, Rep.KuwaitKyrgyz RepublicLao PDRLate-demographic dividendLatin America & Caribbean Latin America & Caribbean (excluding high income)Latin America & the Caribbean (IDA & IBRD countries)LatviaLeast developed countries: UN classificationLebanonLiberiaLibyaLithuaniaLow & middle incomeLow incomeLower middle incomeLuxembourgMacao SAR, ChinaMacedonia, FYRMadagascarMalawiMalaysiaMaldivesMaliMaltaMauritaniaMauritiusMexicoMiddle East & North AfricaMiddle East & North Africa (excluding high income)Middle East & North Africa (IDA & IBRD countries)Middle incomeMoldovaMongoliaMontenegroMoroccoMozambiqueMyanmarNepalNetherlandsNew CaledoniaNew ZealandNicaraguaNigerNigeriaNorth AmericaNorwayOECD membersOmanOther small statesPacific island small statesPakistanPanamaPapua New GuineaParaguayPeruPhilippinesPolandPortugalPost-demographic dividendPre-demographic dividendQatarRomaniaRussian FederationRwandaSaudi ArabiaSenegalSerbiaSeychellesSierra LeoneSingaporeSlovak RepublicSloveniaSmall statesSomaliaSouth AfricaSouth AsiaSouth Asia (IDA & IBRD)SpainSri LankaSt. LuciaSt. Vincent and the GrenadinesSub-Saharan Africa Sub-Saharan Africa (excluding high income)Sub-Saharan Africa (IDA & IBRD countries)SudanSurinameSwedenSwitzerlandSyrian Arab RepublicTajikistanTanzaniaThailandTogoTrinidad and TobagoTunisiaTurkeyTurkmenistanUgandaUkraineUnited Arab EmiratesUnited KingdomUnited StatesUpper middle incomeUruguayVenezuela, RBVietnamWorldYemen, Rep.ZambiaZimbabwe Timeline:
This timeline shows a graph from 1961 to 2015 of Mauritius. No data until 1960. Number of actual observations by date: 54.
Source name:
World Development Indicators
Source organization:
World Bank staff estimates based data from International Monetary Fund's Direction of Trade database.
Categories, topics:
Private Sector, Trade
Last updated:
apr 23, 2017
Indicators value changes by year
Maximum:
18.254
jan 1, 1984
At the date of observation
Value
Absolute change
Change from previous value
jan 1, 1961
0.731
+0.731
0.0%
jan 1, 1962
0.0
-0.731
-100.0%
jan 1, 1966
0.533
+0.533
%
jan 1, 1967
0.581
+0.047
8.85%
jan 1, 1969
0.997
+0.417
71.76%
jan 1, 1970
1.146
+0.149
14.95%
jan 1, 1971
0.426
-0.72
-62.81%
jan 1, 1972
0.317
-0.11
-25.73%
jan 1, 1973
0.722
+0.406
128.17%
jan 1, 1974
0.882
+0.16
22.17%
jan 1, 1975
0.179
-0.703
-79.71%
jan 1, 1976
0.33
+0.151
84.4%
jan 1, 1977
1.409
+1.079
326.89%
jan 1, 1978
4.301
+2.891
205.14%
jan 1, 1979
4.872
+0.571
13.28%
jan 1, 1980
8.758
+3.886
79.78%
jan 1, 1981
11.26
+2.502
28.57%
jan 1, 1982
15.913
+4.653
41.32%
jan 1, 1983
15.814
-0.099
-0.62%
jan 1, 1984
18.254
+2.44
15.43%
jan 1, 1985
15.045
-3.209
-17.58%
jan 1, 1986
13.279
-1.765
-11.73%
jan 1, 1987
7.142
-6.137
-46.22%
jan 1, 1988
6.844
-0.298
-4.17%
jan 1, 1989
4.764
-2.08
-30.39%
jan 1, 1990
6.475
+1.711
35.92%
jan 1, 1991
5.953
-0.522
-8.07%
jan 1, 1992
4.76
-1.193
-20.04%
jan 1, 1993
2.113
-2.647
-55.61%
jan 1, 1994
1.29
-0.823
-38.95%
jan 1, 1995
2.763
+1.473
114.2%
jan 1, 1996
3.975
+1.212
43.87%
jan 1, 1997
4.352
+0.377
9.48%
jan 1, 1998
3.415
-0.937
-21.53%
jan 1, 1999
3.766
+0.351
10.27%
jan 1, 2000
4.93
+1.164
30.9%
jan 1, 2001
5.666
+0.736
14.93%
jan 1, 2002
6.083
+0.418
7.37%
jan 1, 2003
7.706
+1.622
26.67%
jan 1, 2004
8.184
+0.478
6.21%
jan 1, 2005
10.675
+2.491
30.43%
jan 1, 2006
13.954
+3.279
30.72%
jan 1, 2007
9.02
-4.934
-35.36%
jan 1, 2008
3.34
-5.679
-62.97%
jan 1, 2009
2.093
-1.247
-37.33%
jan 1, 2010
1.888
-0.206
-9.83%
jan 1, 2011
2.147
+0.259
13.73%
jan 1, 2012
2.504
+0.357
16.64%
jan 1, 2013
3.078
+0.574
22.93%
jan 1, 2014
2.927
-0.151
-4.91%
jan 1, 2015
3.096
+0.169
5.77%
Ranking of countries by current statistics by years


Comments: