29
/
en
AIzaSyAYiBZKx7MnpbEhh9jyipgxe19OcubqV5w
April 1, 2024
24295
Arab World
ARB
false
2
1
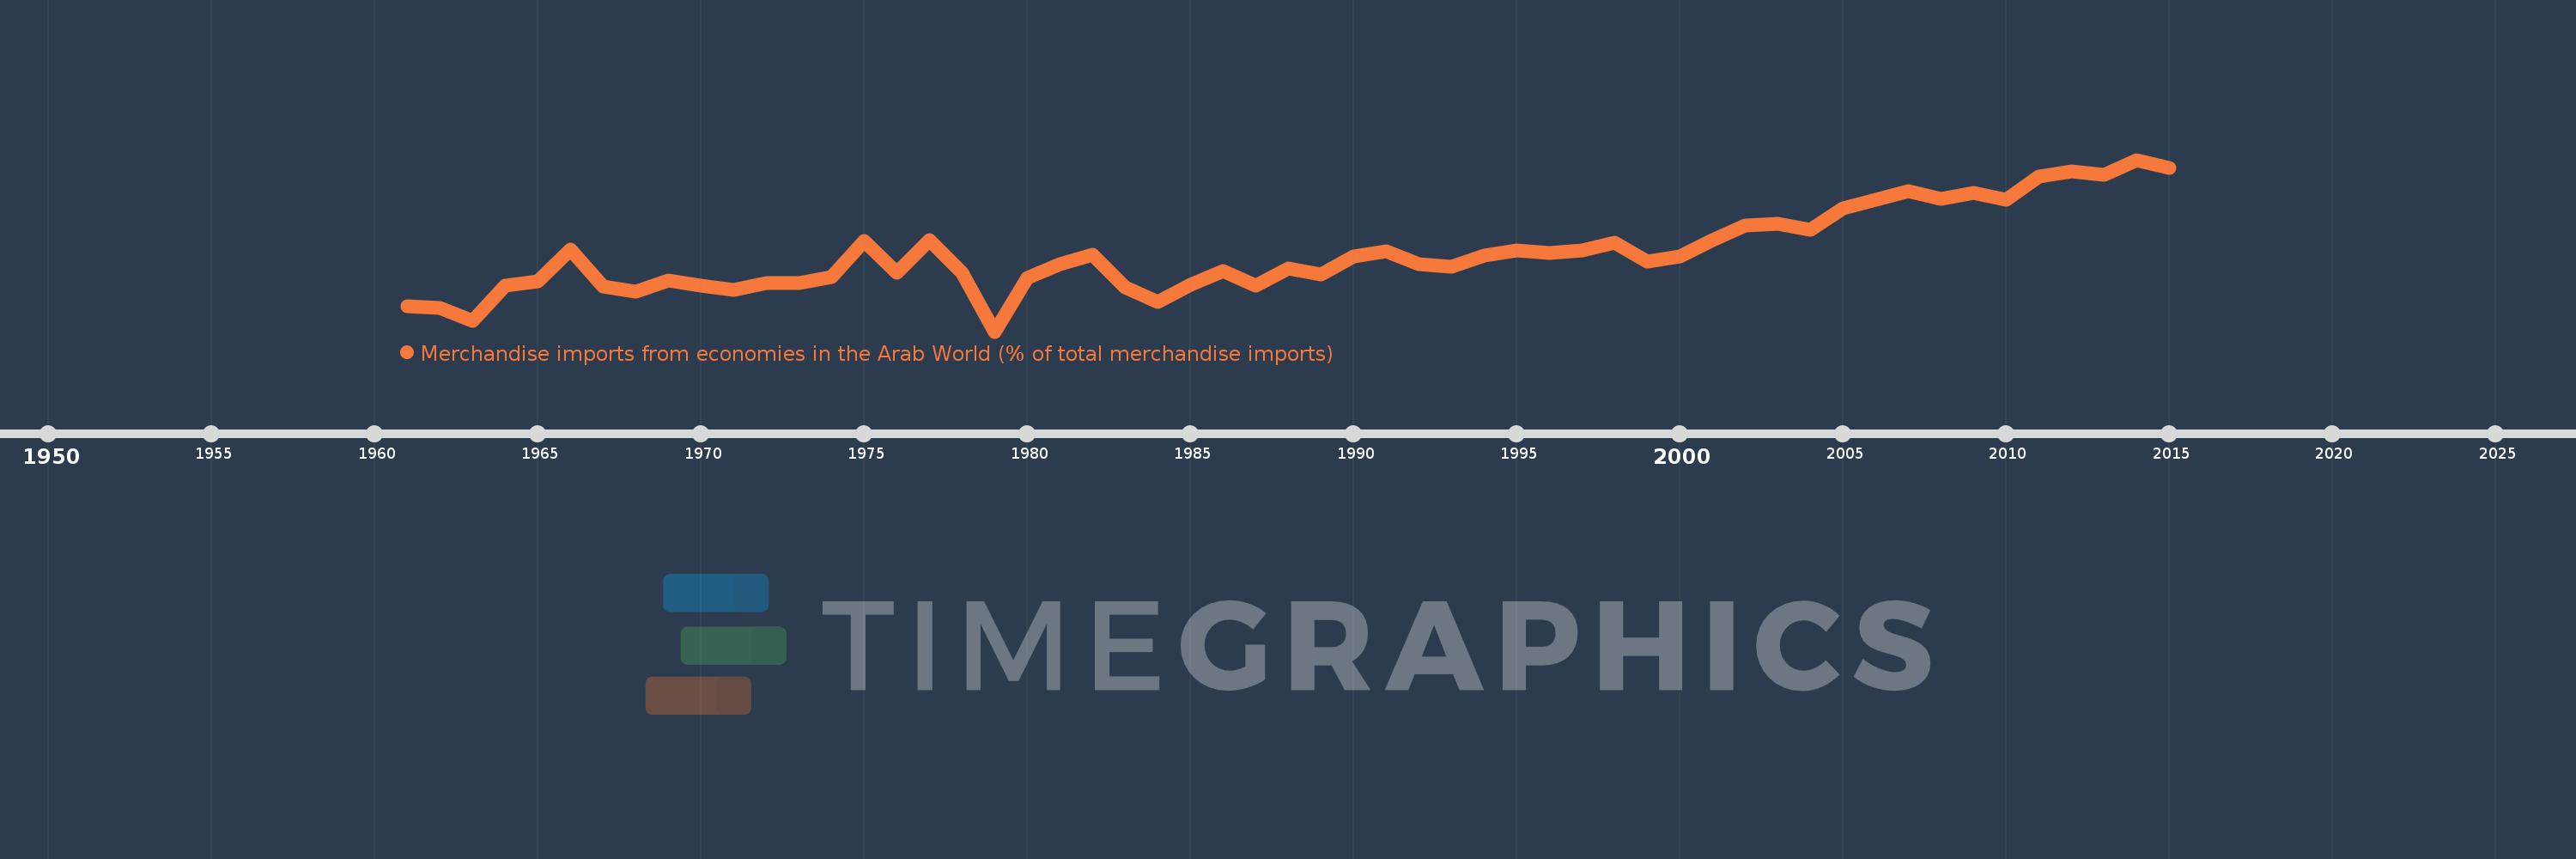
Merchandise imports from economies in the Arab World (% of total merchandise imports)
2015,2014,2013,2012,2011,2010,2009,2008,2007,2006,2005,2004,2003,2002,2001,2000,1999,1998,1997,1996,1995,1994,1993,1992,1991,1990,1989,1988,1987,1986,1985,1984,1983,1982,1981,1980,1979,1978,1977,1976,1975,1974,1973,1972,1971,1970,1969,1968,1967,1966,1965,1964,1963,1962,1961
This statistics in other country:
AfghanistanAlbaniaAlgeriaAngolaArab WorldArgentinaArmeniaArubaAustraliaAustriaAzerbaijanBahamas, TheBahrainBangladeshBarbadosBelarusBelgiumBelizeBeninBermudaBoliviaBrazilBrunei DarussalamBulgariaBurkina FasoBurundiCabo VerdeCambodiaCameroonCanadaCaribbean small statesCentral African RepublicCentral Europe and the BalticsChadChileChinaColombiaComorosCongo, Dem. Rep.Congo, Rep.Costa RicaCote d'IvoireCroatiaCubaCyprusCzech RepublicDenmarkDjiboutiDominicaDominican RepublicEarly-demographic dividendEast Asia & PacificEast Asia & Pacific (excluding high income)East Asia & Pacific (IDA & IBRD countries)EcuadorEgypt, Arab Rep.El SalvadorEstoniaEthiopiaEuro areaEurope & Central AsiaEurope & Central Asia (excluding high income)Europe & Central Asia (IDA & IBRD countries)European UnionFijiFinlandFragile and conflict affected situationsFranceFrench PolynesiaGabonGambia, TheGeorgiaGermanyGhanaGreeceGreenlandGrenadaGuatemalaGuineaGuinea-BissauGuyanaHaitiHeavily indebted poor countries (HIPC)High incomeHondurasHong Kong SAR, ChinaHungaryIBRD onlyIcelandIDA & IBRD totalIDA blendIDA onlyIDA totalIndiaIndonesiaIran, Islamic Rep.IraqIrelandItalyJamaicaJapanJordanKazakhstanKenyaKorea, Dem. People’s Rep.Korea, Rep.KuwaitKyrgyz RepublicLao PDRLate-demographic dividendLatin America & Caribbean Latin America & Caribbean (excluding high income)Latin America & the Caribbean (IDA & IBRD countries)LatviaLeast developed countries: UN classificationLebanonLiberiaLibyaLithuaniaLow & middle incomeLow incomeLower middle incomeLuxembourgMacao SAR, ChinaMacedonia, FYRMadagascarMalawiMalaysiaMaldivesMaliMaltaMauritaniaMauritiusMexicoMiddle East & North AfricaMiddle East & North Africa (excluding high income)Middle East & North Africa (IDA & IBRD countries)Middle incomeMoldovaMongoliaMontenegroMoroccoMozambiqueMyanmarNepalNetherlandsNew CaledoniaNew ZealandNicaraguaNigerNigeriaNorth AmericaNorwayOECD membersOmanOther small statesPacific island small statesPakistanPanamaPapua New GuineaParaguayPeruPhilippinesPolandPortugalPost-demographic dividendPre-demographic dividendQatarRomaniaRussian FederationRwandaSaudi ArabiaSenegalSerbiaSeychellesSierra LeoneSingaporeSlovak RepublicSloveniaSmall statesSomaliaSouth AfricaSouth AsiaSouth Asia (IDA & IBRD)SpainSri LankaSt. LuciaSt. Vincent and the GrenadinesSub-Saharan Africa Sub-Saharan Africa (excluding high income)Sub-Saharan Africa (IDA & IBRD countries)SudanSurinameSwedenSwitzerlandSyrian Arab RepublicTajikistanTanzaniaThailandTogoTrinidad and TobagoTunisiaTurkeyTurkmenistanUgandaUkraineUnited Arab EmiratesUnited KingdomUnited StatesUpper middle incomeUruguayVenezuela, RBVietnamWorldYemen, Rep.ZambiaZimbabwe Timeline:
This timeline shows a graph from 1961 to 2015 of Arab World. No data until 1960. Number of actual observations by date: 55.
Source name:
World Development Indicators
Source organization:
World Bank staff estimates based data from International Monetary Fund's Direction of Trade database.
Categories, topics:
Private Sector, Trade
Last updated:
apr 23, 2017
Indicators value changes by year
Maximum:
16.238
jan 1, 2014
At the date of observation
Value
Absolute change
Change from previous value
jan 1, 1961
6.028
+6.028
0.0%
jan 1, 1962
5.94
-0.088
-1.47%
jan 1, 1963
5.015
-0.925
-15.57%
jan 1, 1964
7.483
+2.468
49.21%
jan 1, 1965
7.813
+0.33
4.41%
jan 1, 1966
10.0
+2.187
27.99%
jan 1, 1967
7.442
-2.557
-25.57%
jan 1, 1968
7.066
-0.377
-5.06%
jan 1, 1969
7.846
+0.781
11.05%
jan 1, 1970
7.47
-0.376
-4.79%
jan 1, 1971
7.21
-0.26
-3.49%
jan 1, 1972
7.67
+0.46
6.38%
jan 1, 1973
7.648
-0.022
-0.28%
jan 1, 1974
8.094
+0.446
5.83%
jan 1, 1975
10.603
+2.509
31.0%
jan 1, 1976
8.387
-2.216
-20.9%
jan 1, 1977
10.68
+2.293
27.34%
jan 1, 1978
8.371
-2.308
-21.61%
jan 1, 1979
4.293
-4.078
-48.72%
jan 1, 1980
8.031
+3.738
87.06%
jan 1, 1981
8.965
+0.934
11.63%
jan 1, 1982
9.611
+0.646
7.2%
jan 1, 1983
7.339
-2.272
-23.64%
jan 1, 1984
6.352
-0.987
-13.45%
jan 1, 1985
7.554
+1.202
18.93%
jan 1, 1986
8.475
+0.921
12.19%
jan 1, 1987
7.5
-0.975
-11.51%
jan 1, 1988
8.695
+1.195
15.94%
jan 1, 1989
8.284
-0.411
-4.73%
jan 1, 1990
9.496
+1.212
14.63%
jan 1, 1991
9.854
+0.358
3.77%
jan 1, 1992
8.963
-0.891
-9.04%
jan 1, 1993
8.777
-0.186
-2.07%
jan 1, 1994
9.557
+0.78
8.89%
jan 1, 1995
9.912
+0.354
3.71%
jan 1, 1996
9.752
-0.16
-1.61%
jan 1, 1997
9.925
+0.173
1.78%
jan 1, 1998
10.489
+0.564
5.69%
jan 1, 1999
9.172
-1.317
-12.56%
jan 1, 2000
9.534
+0.362
3.95%
jan 1, 2001
10.675
+1.141
11.97%
jan 1, 2002
11.689
+1.013
9.49%
jan 1, 2003
11.803
+0.114
0.98%
jan 1, 2004
11.373
-0.43
-3.64%
jan 1, 2005
12.861
+1.488
13.08%
jan 1, 2006
13.446
+0.585
4.55%
jan 1, 2007
14.072
+0.626
4.65%
jan 1, 2008
13.512
-0.56
-3.98%
jan 1, 2009
13.955
+0.443
3.28%
jan 1, 2010
13.462
-0.493
-3.53%
jan 1, 2011
15.085
+1.623
12.05%
jan 1, 2012
15.416
+0.332
2.2%
jan 1, 2013
15.217
-0.2
-1.29%
jan 1, 2014
16.238
+1.022
6.71%
jan 1, 2015
15.663
-0.576
-3.55%
Ranking of countries by current statistics by years


Comments: