29
/
en
AIzaSyAYiBZKx7MnpbEhh9jyipgxe19OcubqV5w
April 1, 2024
37554
IDA & IBRD total
IBT
false
2
1
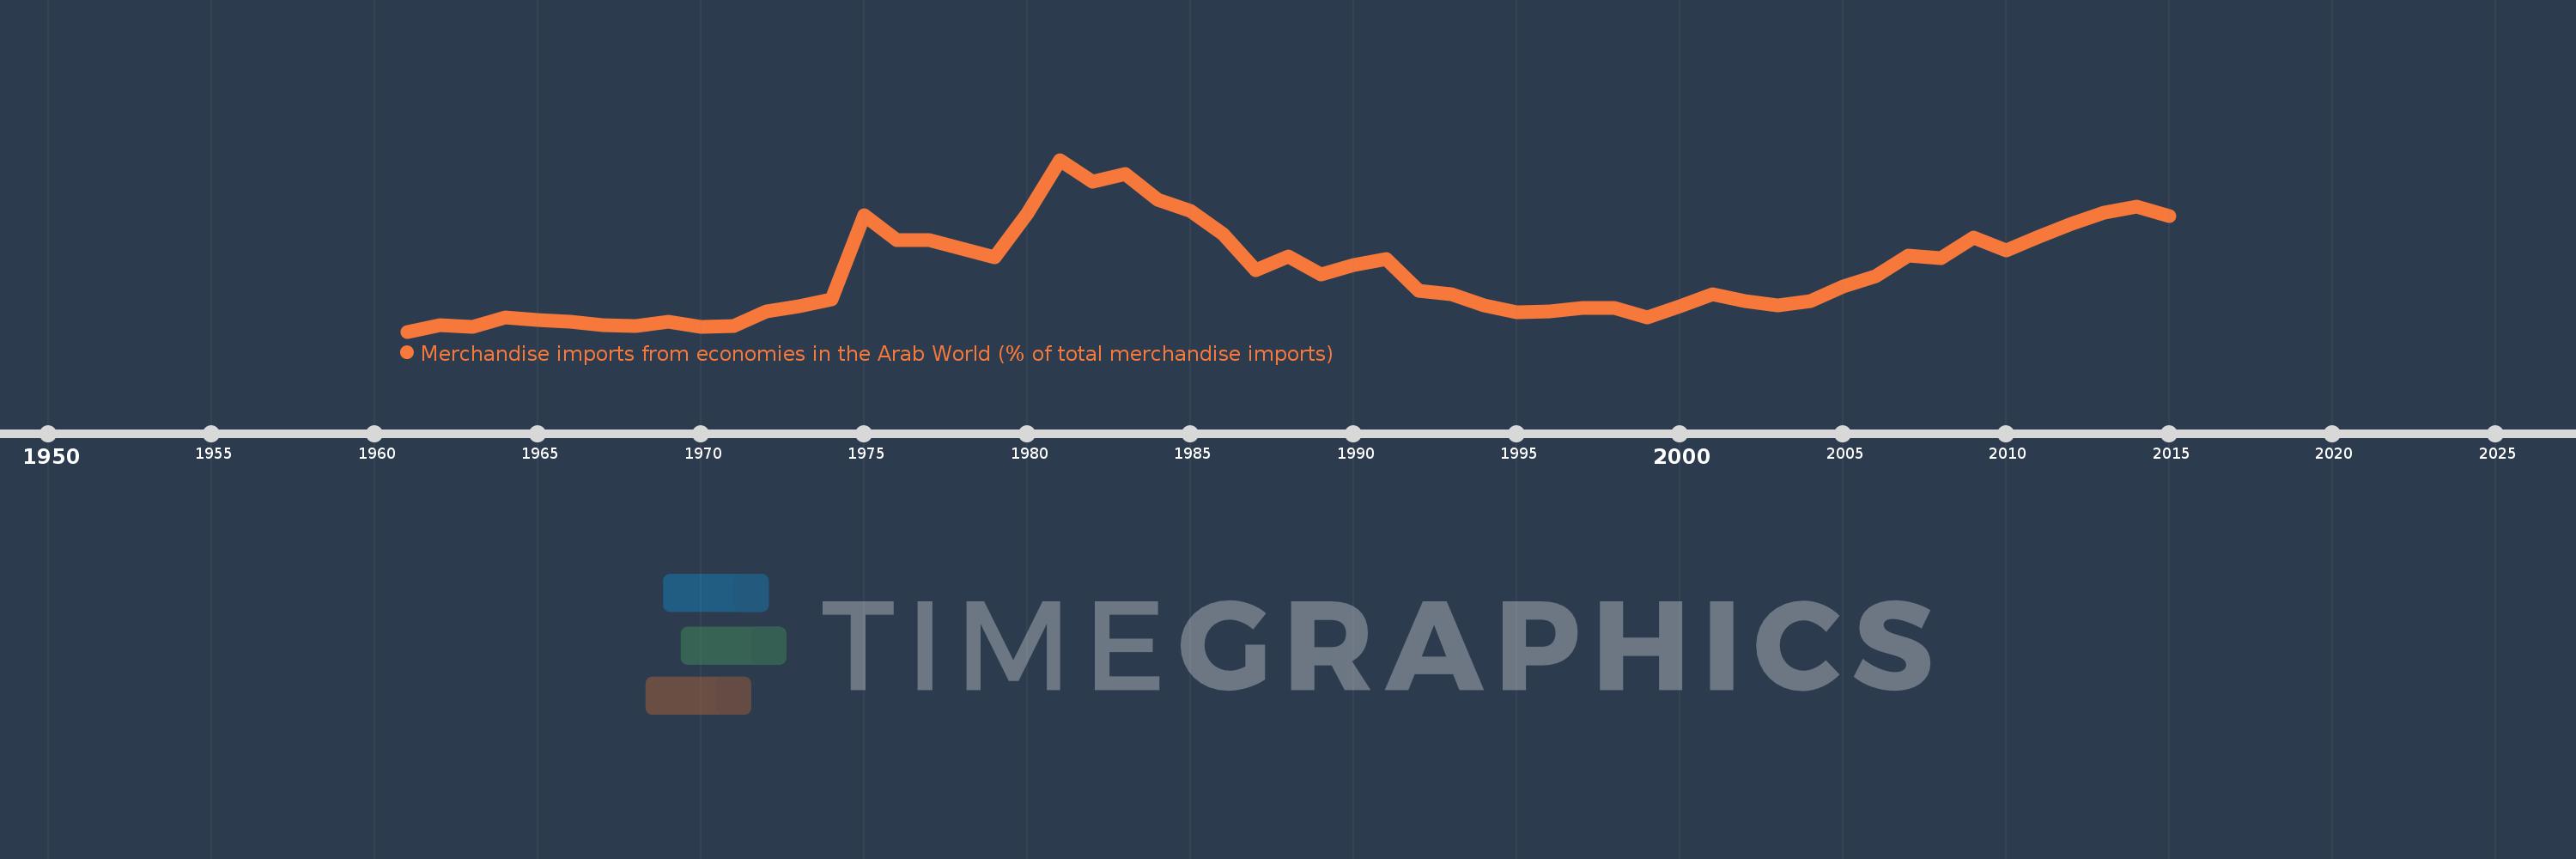
Merchandise imports from economies in the Arab World (% of total merchandise imports)
2015,2014,2013,2012,2011,2010,2009,2008,2007,2006,2005,2004,2003,2002,2001,2000,1999,1998,1997,1996,1995,1994,1993,1992,1991,1990,1989,1988,1987,1986,1985,1984,1983,1982,1981,1980,1979,1978,1977,1976,1975,1974,1973,1972,1971,1970,1969,1968,1967,1966,1965,1964,1963,1962,1961
This statistics in other country:
AfghanistanAlbaniaAlgeriaAngolaArab WorldArgentinaArmeniaArubaAustraliaAustriaAzerbaijanBahamas, TheBahrainBangladeshBarbadosBelarusBelgiumBelizeBeninBermudaBoliviaBrazilBrunei DarussalamBulgariaBurkina FasoBurundiCabo VerdeCambodiaCameroonCanadaCaribbean small statesCentral African RepublicCentral Europe and the BalticsChadChileChinaColombiaComorosCongo, Dem. Rep.Congo, Rep.Costa RicaCote d'IvoireCroatiaCubaCyprusCzech RepublicDenmarkDjiboutiDominicaDominican RepublicEarly-demographic dividendEast Asia & PacificEast Asia & Pacific (excluding high income)East Asia & Pacific (IDA & IBRD countries)EcuadorEgypt, Arab Rep.El SalvadorEstoniaEthiopiaEuro areaEurope & Central AsiaEurope & Central Asia (excluding high income)Europe & Central Asia (IDA & IBRD countries)European UnionFijiFinlandFragile and conflict affected situationsFranceFrench PolynesiaGabonGambia, TheGeorgiaGermanyGhanaGreeceGreenlandGrenadaGuatemalaGuineaGuinea-BissauGuyanaHaitiHeavily indebted poor countries (HIPC)High incomeHondurasHong Kong SAR, ChinaHungaryIBRD onlyIcelandIDA & IBRD totalIDA blendIDA onlyIDA totalIndiaIndonesiaIran, Islamic Rep.IraqIrelandItalyJamaicaJapanJordanKazakhstanKenyaKorea, Dem. People’s Rep.Korea, Rep.KuwaitKyrgyz RepublicLao PDRLate-demographic dividendLatin America & Caribbean Latin America & Caribbean (excluding high income)Latin America & the Caribbean (IDA & IBRD countries)LatviaLeast developed countries: UN classificationLebanonLiberiaLibyaLithuaniaLow & middle incomeLow incomeLower middle incomeLuxembourgMacao SAR, ChinaMacedonia, FYRMadagascarMalawiMalaysiaMaldivesMaliMaltaMauritaniaMauritiusMexicoMiddle East & North AfricaMiddle East & North Africa (excluding high income)Middle East & North Africa (IDA & IBRD countries)Middle incomeMoldovaMongoliaMontenegroMoroccoMozambiqueMyanmarNepalNetherlandsNew CaledoniaNew ZealandNicaraguaNigerNigeriaNorth AmericaNorwayOECD membersOmanOther small statesPacific island small statesPakistanPanamaPapua New GuineaParaguayPeruPhilippinesPolandPortugalPost-demographic dividendPre-demographic dividendQatarRomaniaRussian FederationRwandaSaudi ArabiaSenegalSerbiaSeychellesSierra LeoneSingaporeSlovak RepublicSloveniaSmall statesSomaliaSouth AfricaSouth AsiaSouth Asia (IDA & IBRD)SpainSri LankaSt. LuciaSt. Vincent and the GrenadinesSub-Saharan Africa Sub-Saharan Africa (excluding high income)Sub-Saharan Africa (IDA & IBRD countries)SudanSurinameSwedenSwitzerlandSyrian Arab RepublicTajikistanTanzaniaThailandTogoTrinidad and TobagoTunisiaTurkeyTurkmenistanUgandaUkraineUnited Arab EmiratesUnited KingdomUnited StatesUpper middle incomeUruguayVenezuela, RBVietnamWorldYemen, Rep.ZambiaZimbabwe Timeline:
This timeline shows a graph from 1961 to 2015 of IDA & IBRD total. No data until 1960. Number of actual observations by date: 55.
Source name:
World Development Indicators
Source organization:
World Bank staff estimates based data from International Monetary Fund's Direction of Trade database.
Categories, topics:
Private Sector, Trade
Last updated:
apr 23, 2017
Indicators value changes by year
Maximum:
10.472
jan 1, 1981
At the date of observation
Value
Absolute change
Change from previous value
jan 1, 1961
2.404
+2.404
0.0%
jan 1, 1962
2.721
+0.317
13.18%
jan 1, 1963
2.628
-0.093
-3.43%
jan 1, 1964
3.067
+0.439
16.72%
jan 1, 1965
2.955
-0.112
-3.66%
jan 1, 1966
2.871
-0.084
-2.83%
jan 1, 1967
2.693
-0.179
-6.22%
jan 1, 1968
2.681
-0.012
-0.44%
jan 1, 1969
2.864
+0.183
6.84%
jan 1, 1970
2.642
-0.223
-7.77%
jan 1, 1971
2.672
+0.03
1.13%
jan 1, 1972
3.341
+0.669
25.04%
jan 1, 1973
3.586
+0.245
7.35%
jan 1, 1974
3.934
+0.348
9.71%
jan 1, 1975
7.86
+3.926
99.79%
jan 1, 1976
6.712
-1.148
-14.61%
jan 1, 1977
6.698
-0.014
-0.21%
jan 1, 1978
6.292
-0.406
-6.06%
jan 1, 1979
5.884
-0.408
-6.48%
jan 1, 1980
7.935
+2.051
34.86%
jan 1, 1981
10.472
+2.537
31.97%
jan 1, 1982
9.434
-1.037
-9.91%
jan 1, 1983
9.797
+0.363
3.85%
jan 1, 1984
8.582
-1.215
-12.4%
jan 1, 1985
8.069
-0.513
-5.98%
jan 1, 1986
6.967
-1.102
-13.66%
jan 1, 1987
5.284
-1.683
-24.16%
jan 1, 1988
5.915
+0.631
11.93%
jan 1, 1989
5.067
-0.847
-14.33%
jan 1, 1990
5.546
+0.479
9.44%
jan 1, 1991
5.814
+0.268
4.83%
jan 1, 1992
4.331
-1.483
-25.51%
jan 1, 1993
4.178
-0.152
-3.52%
jan 1, 1994
3.623
-0.555
-13.28%
jan 1, 1995
3.328
-0.295
-8.14%
jan 1, 1996
3.346
+0.017
0.52%
jan 1, 1997
3.527
+0.182
5.43%
jan 1, 1998
3.516
-0.011
-0.31%
jan 1, 1999
3.073
-0.443
-12.6%
jan 1, 2000
3.586
+0.513
16.7%
jan 1, 2001
4.159
+0.573
15.98%
jan 1, 2002
3.846
-0.313
-7.54%
jan 1, 2003
3.628
-0.218
-5.67%
jan 1, 2004
3.85
+0.222
6.12%
jan 1, 2005
4.519
+0.669
17.38%
jan 1, 2006
4.999
+0.479
10.6%
jan 1, 2007
5.963
+0.964
19.29%
jan 1, 2008
5.856
-0.107
-1.79%
jan 1, 2009
6.832
+0.976
16.67%
jan 1, 2010
6.212
-0.62
-9.08%
jan 1, 2011
6.86
+0.648
10.43%
jan 1, 2012
7.465
+0.606
8.83%
jan 1, 2013
7.999
+0.533
7.14%
jan 1, 2014
8.259
+0.261
3.26%
jan 1, 2015
7.842
-0.417
-5.05%
Ranking of countries by current statistics by years


Comments: