29
/
en
AIzaSyAYiBZKx7MnpbEhh9jyipgxe19OcubqV5w
April 1, 2024
133402
Finland
FIN
true
2
1
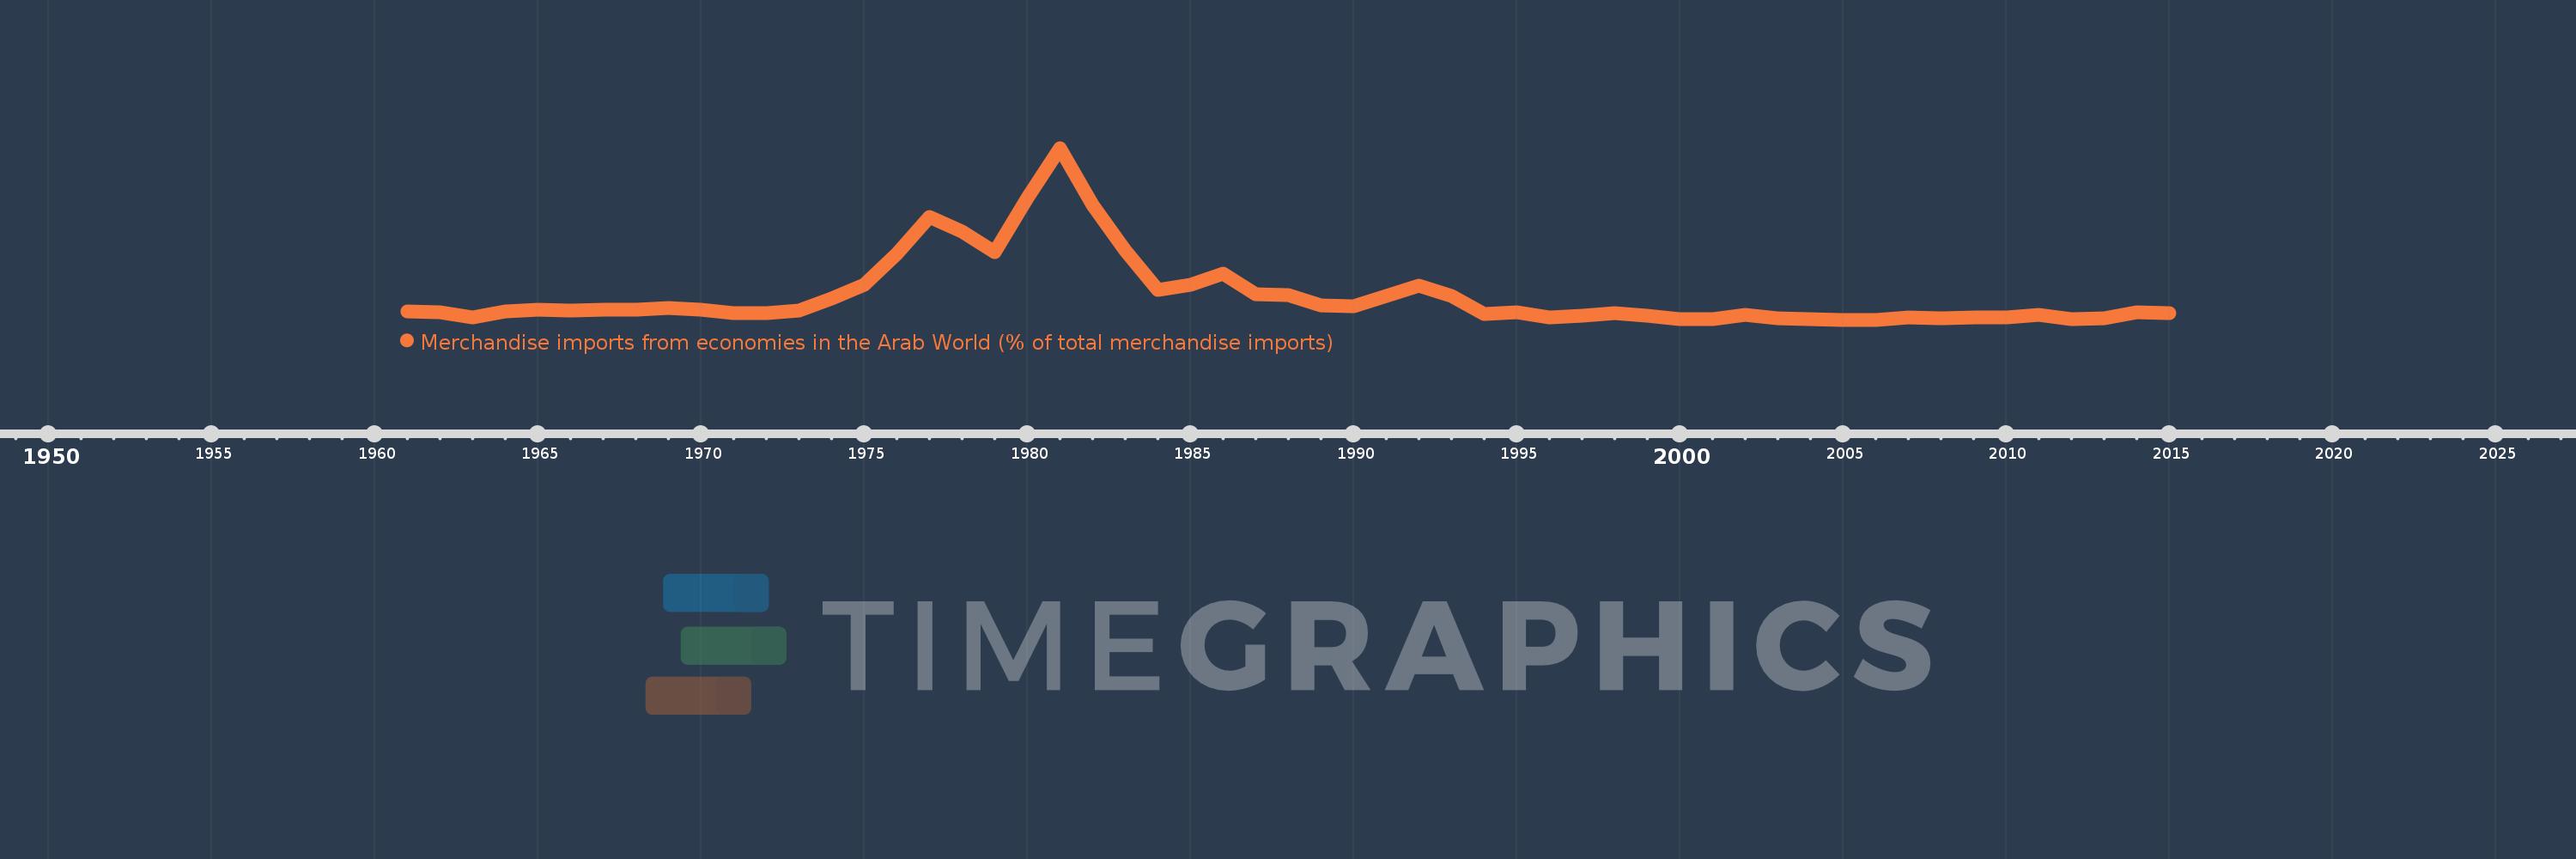
Merchandise imports from economies in the Arab World (% of total merchandise imports)
2015,2014,2013,2012,2011,2010,2009,2008,2007,2006,2005,2004,2003,2002,2001,2000,1999,1998,1997,1996,1995,1994,1993,1992,1991,1990,1989,1988,1987,1986,1985,1984,1983,1982,1981,1980,1979,1978,1977,1976,1975,1974,1973,1972,1971,1970,1969,1968,1967,1966,1965,1964,1963,1962,1961
This statistics in other country:
AfghanistanAlbaniaAlgeriaAngolaArab WorldArgentinaArmeniaArubaAustraliaAustriaAzerbaijanBahamas, TheBahrainBangladeshBarbadosBelarusBelgiumBelizeBeninBermudaBoliviaBrazilBrunei DarussalamBulgariaBurkina FasoBurundiCabo VerdeCambodiaCameroonCanadaCaribbean small statesCentral African RepublicCentral Europe and the BalticsChadChileChinaColombiaComorosCongo, Dem. Rep.Congo, Rep.Costa RicaCote d'IvoireCroatiaCubaCyprusCzech RepublicDenmarkDjiboutiDominicaDominican RepublicEarly-demographic dividendEast Asia & PacificEast Asia & Pacific (excluding high income)East Asia & Pacific (IDA & IBRD countries)EcuadorEgypt, Arab Rep.El SalvadorEstoniaEthiopiaEuro areaEurope & Central AsiaEurope & Central Asia (excluding high income)Europe & Central Asia (IDA & IBRD countries)European UnionFijiFinlandFragile and conflict affected situationsFranceFrench PolynesiaGabonGambia, TheGeorgiaGermanyGhanaGreeceGreenlandGrenadaGuatemalaGuineaGuinea-BissauGuyanaHaitiHeavily indebted poor countries (HIPC)High incomeHondurasHong Kong SAR, ChinaHungaryIBRD onlyIcelandIDA & IBRD totalIDA blendIDA onlyIDA totalIndiaIndonesiaIran, Islamic Rep.IraqIrelandItalyJamaicaJapanJordanKazakhstanKenyaKorea, Dem. People’s Rep.Korea, Rep.KuwaitKyrgyz RepublicLao PDRLate-demographic dividendLatin America & Caribbean Latin America & Caribbean (excluding high income)Latin America & the Caribbean (IDA & IBRD countries)LatviaLeast developed countries: UN classificationLebanonLiberiaLibyaLithuaniaLow & middle incomeLow incomeLower middle incomeLuxembourgMacao SAR, ChinaMacedonia, FYRMadagascarMalawiMalaysiaMaldivesMaliMaltaMauritaniaMauritiusMexicoMiddle East & North AfricaMiddle East & North Africa (excluding high income)Middle East & North Africa (IDA & IBRD countries)Middle incomeMoldovaMongoliaMontenegroMoroccoMozambiqueMyanmarNepalNetherlandsNew CaledoniaNew ZealandNicaraguaNigerNigeriaNorth AmericaNorwayOECD membersOmanOther small statesPacific island small statesPakistanPanamaPapua New GuineaParaguayPeruPhilippinesPolandPortugalPost-demographic dividendPre-demographic dividendQatarRomaniaRussian FederationRwandaSaudi ArabiaSenegalSerbiaSeychellesSierra LeoneSingaporeSlovak RepublicSloveniaSmall statesSomaliaSouth AfricaSouth AsiaSouth Asia (IDA & IBRD)SpainSri LankaSt. LuciaSt. Vincent and the GrenadinesSub-Saharan Africa Sub-Saharan Africa (excluding high income)Sub-Saharan Africa (IDA & IBRD countries)SudanSurinameSwedenSwitzerlandSyrian Arab RepublicTajikistanTanzaniaThailandTogoTrinidad and TobagoTunisiaTurkeyTurkmenistanUgandaUkraineUnited Arab EmiratesUnited KingdomUnited StatesUpper middle incomeUruguayVenezuela, RBVietnamWorldYemen, Rep.ZambiaZimbabwe Timeline:
This timeline shows a graph from 1961 to 2015 of Finland. No data until 1960. Number of actual observations by date: 55.
Source name:
World Development Indicators
Source organization:
World Bank staff estimates based data from International Monetary Fund's Direction of Trade database.
Categories, topics:
Private Sector, Trade
Last updated:
apr 23, 2017
Indicators value changes by year
At the date of observation
Value
Absolute change
Change from previous value
jan 1, 1961
0.389
+0.389
0.0%
jan 1, 1962
0.375
-0.014
-3.53%
jan 1, 1963
0.171
-0.204
-54.43%
jan 1, 1964
0.408
+0.237
138.3%
jan 1, 1965
0.474
+0.066
16.31%
jan 1, 1966
0.439
-0.036
-7.5%
jan 1, 1967
0.469
+0.03
6.95%
jan 1, 1968
0.472
+0.003
0.58%
jan 1, 1969
0.54
+0.068
14.49%
jan 1, 1970
0.447
-0.093
-17.23%
jan 1, 1971
0.337
-0.11
-24.59%
jan 1, 1972
0.331
-0.006
-1.73%
jan 1, 1973
0.44
+0.109
32.96%
jan 1, 1974
0.892
+0.452
102.51%
jan 1, 1975
1.437
+0.545
61.06%
jan 1, 1976
2.686
+1.249
86.94%
jan 1, 1977
4.13
+1.444
53.77%
jan 1, 1978
3.577
-0.553
-13.39%
jan 1, 1979
2.747
-0.83
-23.2%
jan 1, 1980
4.896
+2.149
78.23%
jan 1, 1981
6.874
+1.978
40.4%
jan 1, 1982
4.612
-2.261
-32.9%
jan 1, 1983
2.824
-1.788
-38.77%
jan 1, 1984
1.236
-1.588
-56.23%
jan 1, 1985
1.445
+0.209
16.92%
jan 1, 1986
1.89
+0.445
30.76%
jan 1, 1987
1.064
-0.826
-43.69%
jan 1, 1988
1.032
-0.032
-3.05%
jan 1, 1989
0.626
-0.406
-39.34%
jan 1, 1990
0.61
-0.016
-2.54%
jan 1, 1991
1.011
+0.401
65.8%
jan 1, 1992
1.408
+0.397
39.26%
jan 1, 1993
1.022
-0.386
-27.43%
jan 1, 1994
0.305
-0.717
-70.12%
jan 1, 1995
0.364
+0.059
19.18%
jan 1, 1996
0.156
-0.208
-57.08%
jan 1, 1997
0.23
+0.074
47.14%
jan 1, 1998
0.332
+0.102
44.52%
jan 1, 1999
0.226
-0.106
-32.07%
jan 1, 2000
0.093
-0.133
-58.89%
jan 1, 2001
0.074
-0.019
-20.27%
jan 1, 2002
0.243
+0.169
228.8%
jan 1, 2003
0.123
-0.12
-49.31%
jan 1, 2004
0.072
-0.051
-41.73%
jan 1, 2005
0.065
-0.006
-8.97%
jan 1, 2006
0.068
+0.002
3.42%
jan 1, 2007
0.173
+0.105
155.76%
jan 1, 2008
0.129
-0.044
-25.53%
jan 1, 2009
0.17
+0.041
31.82%
jan 1, 2010
0.141
-0.029
-16.92%
jan 1, 2011
0.257
+0.116
82.08%
jan 1, 2012
0.099
-0.158
-61.41%
jan 1, 2013
0.106
+0.007
6.75%
jan 1, 2014
0.348
+0.242
228.86%
jan 1, 2015
0.312
-0.036
-10.26%
Ranking of countries by current statistics by years


Comments: