29
/
en
AIzaSyAYiBZKx7MnpbEhh9jyipgxe19OcubqV5w
April 1, 2024
46313
Low income
LIC
false
2
1
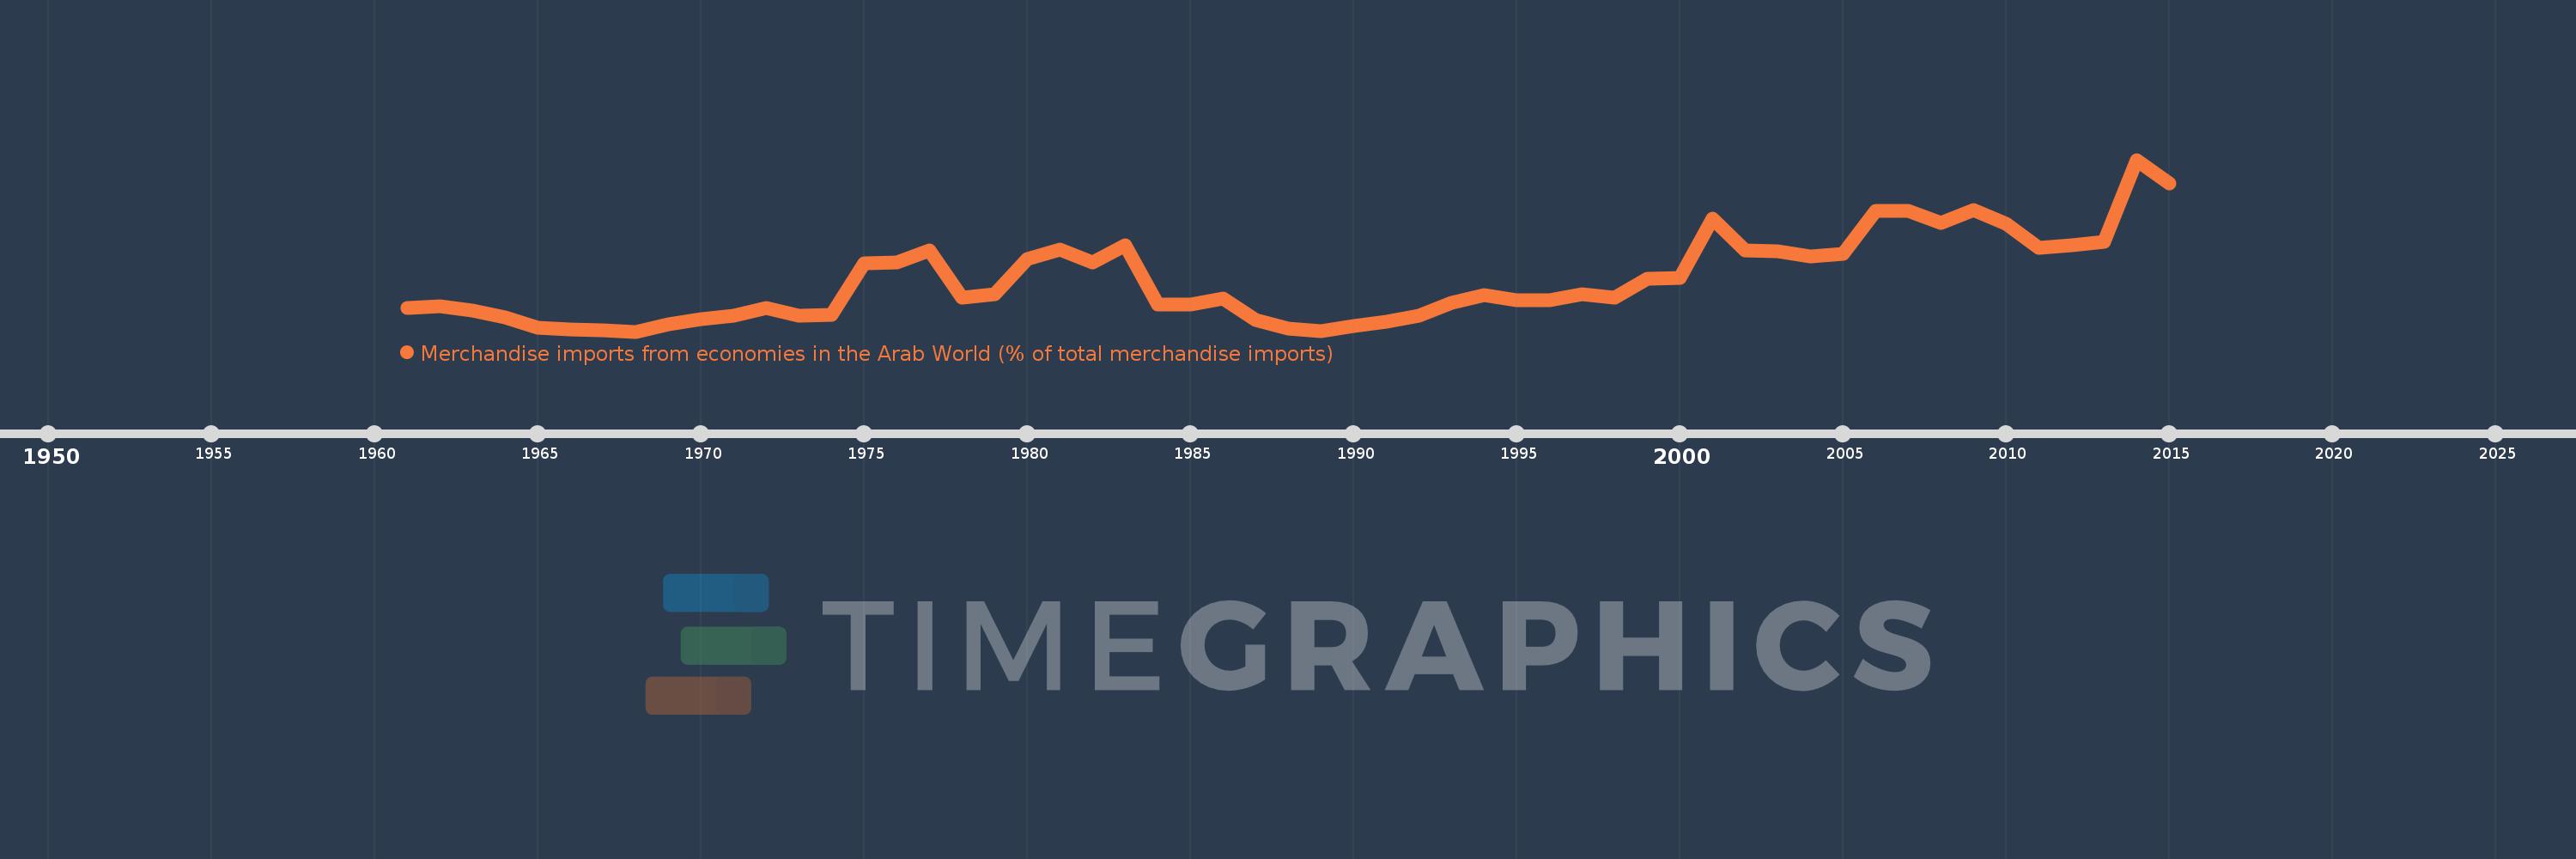
Merchandise imports from economies in the Arab World (% of total merchandise imports)
2015,2014,2013,2012,2011,2010,2009,2008,2007,2006,2005,2004,2003,2002,2001,2000,1999,1998,1997,1996,1995,1994,1993,1992,1991,1990,1989,1988,1987,1986,1985,1984,1983,1982,1981,1980,1979,1978,1977,1976,1975,1974,1973,1972,1971,1970,1969,1968,1967,1966,1965,1964,1963,1962,1961
This statistics in other country:
AfghanistanAlbaniaAlgeriaAngolaArab WorldArgentinaArmeniaArubaAustraliaAustriaAzerbaijanBahamas, TheBahrainBangladeshBarbadosBelarusBelgiumBelizeBeninBermudaBoliviaBrazilBrunei DarussalamBulgariaBurkina FasoBurundiCabo VerdeCambodiaCameroonCanadaCaribbean small statesCentral African RepublicCentral Europe and the BalticsChadChileChinaColombiaComorosCongo, Dem. Rep.Congo, Rep.Costa RicaCote d'IvoireCroatiaCubaCyprusCzech RepublicDenmarkDjiboutiDominicaDominican RepublicEarly-demographic dividendEast Asia & PacificEast Asia & Pacific (excluding high income)East Asia & Pacific (IDA & IBRD countries)EcuadorEgypt, Arab Rep.El SalvadorEstoniaEthiopiaEuro areaEurope & Central AsiaEurope & Central Asia (excluding high income)Europe & Central Asia (IDA & IBRD countries)European UnionFijiFinlandFragile and conflict affected situationsFranceFrench PolynesiaGabonGambia, TheGeorgiaGermanyGhanaGreeceGreenlandGrenadaGuatemalaGuineaGuinea-BissauGuyanaHaitiHeavily indebted poor countries (HIPC)High incomeHondurasHong Kong SAR, ChinaHungaryIBRD onlyIcelandIDA & IBRD totalIDA blendIDA onlyIDA totalIndiaIndonesiaIran, Islamic Rep.IraqIrelandItalyJamaicaJapanJordanKazakhstanKenyaKorea, Dem. People’s Rep.Korea, Rep.KuwaitKyrgyz RepublicLao PDRLate-demographic dividendLatin America & Caribbean Latin America & Caribbean (excluding high income)Latin America & the Caribbean (IDA & IBRD countries)LatviaLeast developed countries: UN classificationLebanonLiberiaLibyaLithuaniaLow & middle incomeLow incomeLower middle incomeLuxembourgMacao SAR, ChinaMacedonia, FYRMadagascarMalawiMalaysiaMaldivesMaliMaltaMauritaniaMauritiusMexicoMiddle East & North AfricaMiddle East & North Africa (excluding high income)Middle East & North Africa (IDA & IBRD countries)Middle incomeMoldovaMongoliaMontenegroMoroccoMozambiqueMyanmarNepalNetherlandsNew CaledoniaNew ZealandNicaraguaNigerNigeriaNorth AmericaNorwayOECD membersOmanOther small statesPacific island small statesPakistanPanamaPapua New GuineaParaguayPeruPhilippinesPolandPortugalPost-demographic dividendPre-demographic dividendQatarRomaniaRussian FederationRwandaSaudi ArabiaSenegalSerbiaSeychellesSierra LeoneSingaporeSlovak RepublicSloveniaSmall statesSomaliaSouth AfricaSouth AsiaSouth Asia (IDA & IBRD)SpainSri LankaSt. LuciaSt. Vincent and the GrenadinesSub-Saharan Africa Sub-Saharan Africa (excluding high income)Sub-Saharan Africa (IDA & IBRD countries)SudanSurinameSwedenSwitzerlandSyrian Arab RepublicTajikistanTanzaniaThailandTogoTrinidad and TobagoTunisiaTurkeyTurkmenistanUgandaUkraineUnited Arab EmiratesUnited KingdomUnited StatesUpper middle incomeUruguayVenezuela, RBVietnamWorldYemen, Rep.ZambiaZimbabwe Timeline:
This timeline shows a graph from 1961 to 2015 of Low income. No data until 1960. Number of actual observations by date: 55.
Source name:
World Development Indicators
Source organization:
World Bank staff estimates based data from International Monetary Fund's Direction of Trade database.
Categories, topics:
Private Sector, Trade
Last updated:
apr 23, 2017
Indicators value changes by year
Maximum:
10.044
jan 1, 2014
At the date of observation
Value
Absolute change
Change from previous value
jan 1, 1961
2.604
+2.604
0.0%
jan 1, 1962
2.718
+0.113
4.35%
jan 1, 1963
2.478
-0.24
-8.83%
jan 1, 1964
2.142
-0.336
-13.55%
jan 1, 1965
1.624
-0.518
-24.16%
jan 1, 1966
1.544
-0.08
-4.95%
jan 1, 1967
1.515
-0.029
-1.89%
jan 1, 1968
1.439
-0.076
-4.99%
jan 1, 1969
1.814
+0.374
26.01%
jan 1, 1970
2.053
+0.24
13.22%
jan 1, 1971
2.242
+0.188
9.17%
jan 1, 1972
2.63
+0.389
17.34%
jan 1, 1973
2.248
-0.382
-14.53%
jan 1, 1974
2.274
+0.026
1.14%
jan 1, 1975
4.845
+2.571
113.08%
jan 1, 1976
4.884
+0.039
0.81%
jan 1, 1977
5.508
+0.623
12.76%
jan 1, 1978
3.126
-2.381
-43.23%
jan 1, 1979
3.3
+0.173
5.54%
jan 1, 1980
5.076
+1.776
53.83%
jan 1, 1981
5.528
+0.452
8.9%
jan 1, 1982
4.899
-0.629
-11.38%
jan 1, 1983
5.757
+0.858
17.51%
jan 1, 1984
2.798
-2.959
-51.4%
jan 1, 1985
2.807
+0.009
0.33%
jan 1, 1986
3.084
+0.277
9.87%
jan 1, 1987
2.03
-1.055
-34.19%
jan 1, 1988
1.596
-0.434
-21.37%
jan 1, 1989
1.446
-0.15
-9.38%
jan 1, 1990
1.735
+0.289
20.0%
jan 1, 1991
1.913
+0.177
10.21%
jan 1, 1992
2.234
+0.322
16.82%
jan 1, 1993
2.887
+0.652
29.2%
jan 1, 1994
3.262
+0.375
12.99%
jan 1, 1995
3.016
-0.246
-7.54%
jan 1, 1996
3.005
-0.011
-0.36%
jan 1, 1997
3.308
+0.303
10.09%
jan 1, 1998
3.143
-0.166
-5.01%
jan 1, 1999
4.078
+0.935
29.75%
jan 1, 2000
4.122
+0.044
1.08%
jan 1, 2001
7.116
+2.994
72.63%
jan 1, 2002
5.524
-1.592
-22.37%
jan 1, 2003
5.463
-0.062
-1.11%
jan 1, 2004
5.225
-0.238
-4.35%
jan 1, 2005
5.317
+0.092
1.76%
jan 1, 2006
7.499
+2.182
41.03%
jan 1, 2007
7.472
-0.027
-0.37%
jan 1, 2008
6.902
-0.57
-7.63%
jan 1, 2009
7.547
+0.645
9.34%
jan 1, 2010
6.829
-0.717
-9.5%
jan 1, 2011
5.646
-1.183
-17.33%
jan 1, 2012
5.756
+0.11
1.94%
jan 1, 2013
5.951
+0.196
3.4%
jan 1, 2014
10.044
+4.093
68.77%
jan 1, 2015
8.875
-1.169
-11.63%
Ranking of countries by current statistics by years


Comments: