29
/
en
AIzaSyAYiBZKx7MnpbEhh9jyipgxe19OcubqV5w
April 1, 2024
258588
Syrian Arab Republic
SYR
true
2
1
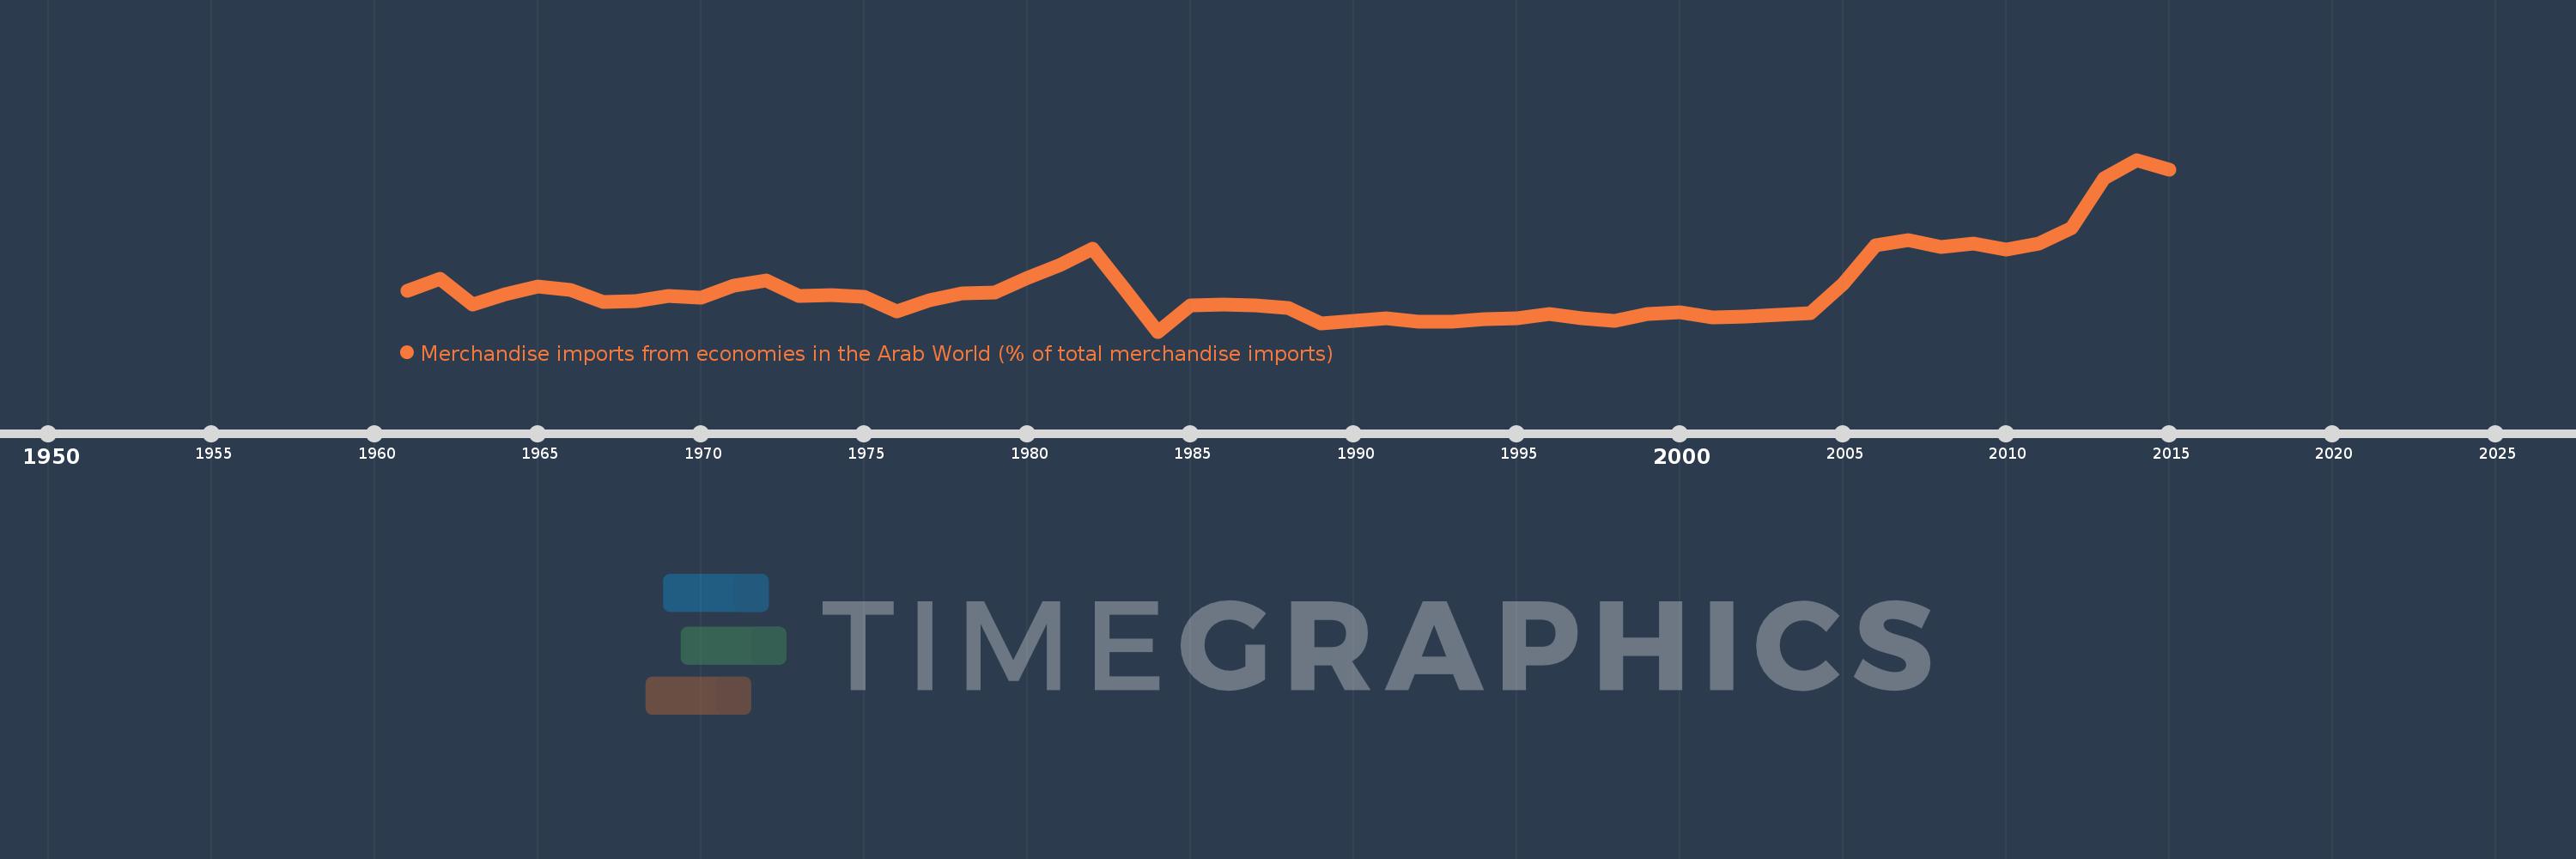
Merchandise imports from economies in the Arab World (% of total merchandise imports)
2015,2014,2013,2012,2011,2010,2009,2008,2007,2006,2005,2004,2003,2002,2001,2000,1999,1998,1997,1996,1995,1994,1993,1992,1991,1990,1989,1988,1987,1986,1985,1984,1983,1982,1981,1980,1979,1978,1977,1976,1975,1974,1973,1972,1971,1970,1969,1968,1967,1966,1965,1964,1963,1962,1961
This statistics in other country:
AfghanistanAlbaniaAlgeriaAngolaArab WorldArgentinaArmeniaArubaAustraliaAustriaAzerbaijanBahamas, TheBahrainBangladeshBarbadosBelarusBelgiumBelizeBeninBermudaBoliviaBrazilBrunei DarussalamBulgariaBurkina FasoBurundiCabo VerdeCambodiaCameroonCanadaCaribbean small statesCentral African RepublicCentral Europe and the BalticsChadChileChinaColombiaComorosCongo, Dem. Rep.Congo, Rep.Costa RicaCote d'IvoireCroatiaCubaCyprusCzech RepublicDenmarkDjiboutiDominicaDominican RepublicEarly-demographic dividendEast Asia & PacificEast Asia & Pacific (excluding high income)East Asia & Pacific (IDA & IBRD countries)EcuadorEgypt, Arab Rep.El SalvadorEstoniaEthiopiaEuro areaEurope & Central AsiaEurope & Central Asia (excluding high income)Europe & Central Asia (IDA & IBRD countries)European UnionFijiFinlandFragile and conflict affected situationsFranceFrench PolynesiaGabonGambia, TheGeorgiaGermanyGhanaGreeceGreenlandGrenadaGuatemalaGuineaGuinea-BissauGuyanaHaitiHeavily indebted poor countries (HIPC)High incomeHondurasHong Kong SAR, ChinaHungaryIBRD onlyIcelandIDA & IBRD totalIDA blendIDA onlyIDA totalIndiaIndonesiaIran, Islamic Rep.IraqIrelandItalyJamaicaJapanJordanKazakhstanKenyaKorea, Dem. People’s Rep.Korea, Rep.KuwaitKyrgyz RepublicLao PDRLate-demographic dividendLatin America & Caribbean Latin America & Caribbean (excluding high income)Latin America & the Caribbean (IDA & IBRD countries)LatviaLeast developed countries: UN classificationLebanonLiberiaLibyaLithuaniaLow & middle incomeLow incomeLower middle incomeLuxembourgMacao SAR, ChinaMacedonia, FYRMadagascarMalawiMalaysiaMaldivesMaliMaltaMauritaniaMauritiusMexicoMiddle East & North AfricaMiddle East & North Africa (excluding high income)Middle East & North Africa (IDA & IBRD countries)Middle incomeMoldovaMongoliaMontenegroMoroccoMozambiqueMyanmarNepalNetherlandsNew CaledoniaNew ZealandNicaraguaNigerNigeriaNorth AmericaNorwayOECD membersOmanOther small statesPacific island small statesPakistanPanamaPapua New GuineaParaguayPeruPhilippinesPolandPortugalPost-demographic dividendPre-demographic dividendQatarRomaniaRussian FederationRwandaSaudi ArabiaSenegalSerbiaSeychellesSierra LeoneSingaporeSlovak RepublicSloveniaSmall statesSomaliaSouth AfricaSouth AsiaSouth Asia (IDA & IBRD)SpainSri LankaSt. LuciaSt. Vincent and the GrenadinesSub-Saharan Africa Sub-Saharan Africa (excluding high income)Sub-Saharan Africa (IDA & IBRD countries)SudanSurinameSwedenSwitzerlandSyrian Arab RepublicTajikistanTanzaniaThailandTogoTrinidad and TobagoTunisiaTurkeyTurkmenistanUgandaUkraineUnited Arab EmiratesUnited KingdomUnited StatesUpper middle incomeUruguayVenezuela, RBVietnamWorldYemen, Rep.ZambiaZimbabwe Timeline:
This timeline shows a graph from 1961 to 2015 of Syrian Arab Republic. No data until 1960. Number of actual observations by date: 55.
Source name:
World Development Indicators
Source organization:
World Bank staff estimates based data from International Monetary Fund's Direction of Trade database.
Categories, topics:
Private Sector, Trade
Last updated:
apr 23, 2017
Indicators value changes by year
Maximum:
60.822
jan 1, 2014
At the date of observation
Value
Absolute change
Change from previous value
jan 1, 1961
15.814
+15.814
0.0%
jan 1, 1962
20.091
+4.277
27.05%
jan 1, 1963
11.13
-8.961
-44.6%
jan 1, 1964
14.667
+3.537
31.78%
jan 1, 1965
17.249
+2.581
17.6%
jan 1, 1966
15.968
-1.281
-7.43%
jan 1, 1967
11.939
-4.029
-25.23%
jan 1, 1968
12.168
+0.23
1.92%
jan 1, 1969
14.139
+1.971
16.2%
jan 1, 1970
13.549
-0.59
-4.17%
jan 1, 1971
17.499
+3.95
29.15%
jan 1, 1972
19.445
+1.946
11.12%
jan 1, 1973
13.964
-5.481
-28.19%
jan 1, 1974
14.223
+0.259
1.85%
jan 1, 1975
13.779
-0.444
-3.12%
jan 1, 1976
8.805
-4.974
-36.09%
jan 1, 1977
12.62
+3.814
43.32%
jan 1, 1978
14.906
+2.286
18.12%
jan 1, 1979
15.373
+0.467
3.13%
jan 1, 1980
20.125
+4.752
30.91%
jan 1, 1981
24.659
+4.534
22.53%
jan 1, 1982
30.31
+5.651
22.92%
jan 1, 1983
16.231
-14.08
-46.45%
jan 1, 1984
1.803
-14.427
-88.89%
jan 1, 1985
10.922
+9.118
505.6%
jan 1, 1986
11.001
+0.079
0.73%
jan 1, 1987
10.856
-0.145
-1.32%
jan 1, 1988
10.023
-0.833
-7.67%
jan 1, 1989
4.485
-5.538
-55.25%
jan 1, 1990
5.634
+1.149
25.63%
jan 1, 1991
6.275
+0.64
11.36%
jan 1, 1992
5.126
-1.149
-18.31%
jan 1, 1993
5.292
+0.167
3.25%
jan 1, 1994
6.215
+0.923
17.43%
jan 1, 1995
6.519
+0.303
4.88%
jan 1, 1996
7.812
+1.294
19.84%
jan 1, 1997
6.413
-1.399
-17.91%
jan 1, 1998
5.528
-0.885
-13.8%
jan 1, 1999
7.87
+2.342
42.37%
jan 1, 2000
8.305
+0.435
5.53%
jan 1, 2001
6.724
-1.58
-19.03%
jan 1, 2002
6.842
+0.117
1.74%
jan 1, 2003
7.444
+0.602
8.8%
jan 1, 2004
8.084
+0.64
8.6%
jan 1, 2005
18.284
+10.2
126.17%
jan 1, 2006
31.435
+13.152
71.93%
jan 1, 2007
33.097
+1.662
5.29%
jan 1, 2008
30.723
-2.374
-7.17%
jan 1, 2009
31.937
+1.215
3.95%
jan 1, 2010
30.06
-1.877
-5.88%
jan 1, 2011
32.089
+2.028
6.75%
jan 1, 2012
37.502
+5.413
16.87%
jan 1, 2013
54.362
+16.86
44.96%
jan 1, 2014
60.822
+6.461
11.88%
jan 1, 2015
57.48
-3.342
-5.5%
Ranking of countries by current statistics by years


Comments: