29
/
en
AIzaSyAYiBZKx7MnpbEhh9jyipgxe19OcubqV5w
April 1, 2024
78530
Bangladesh
BGD
true
2
1
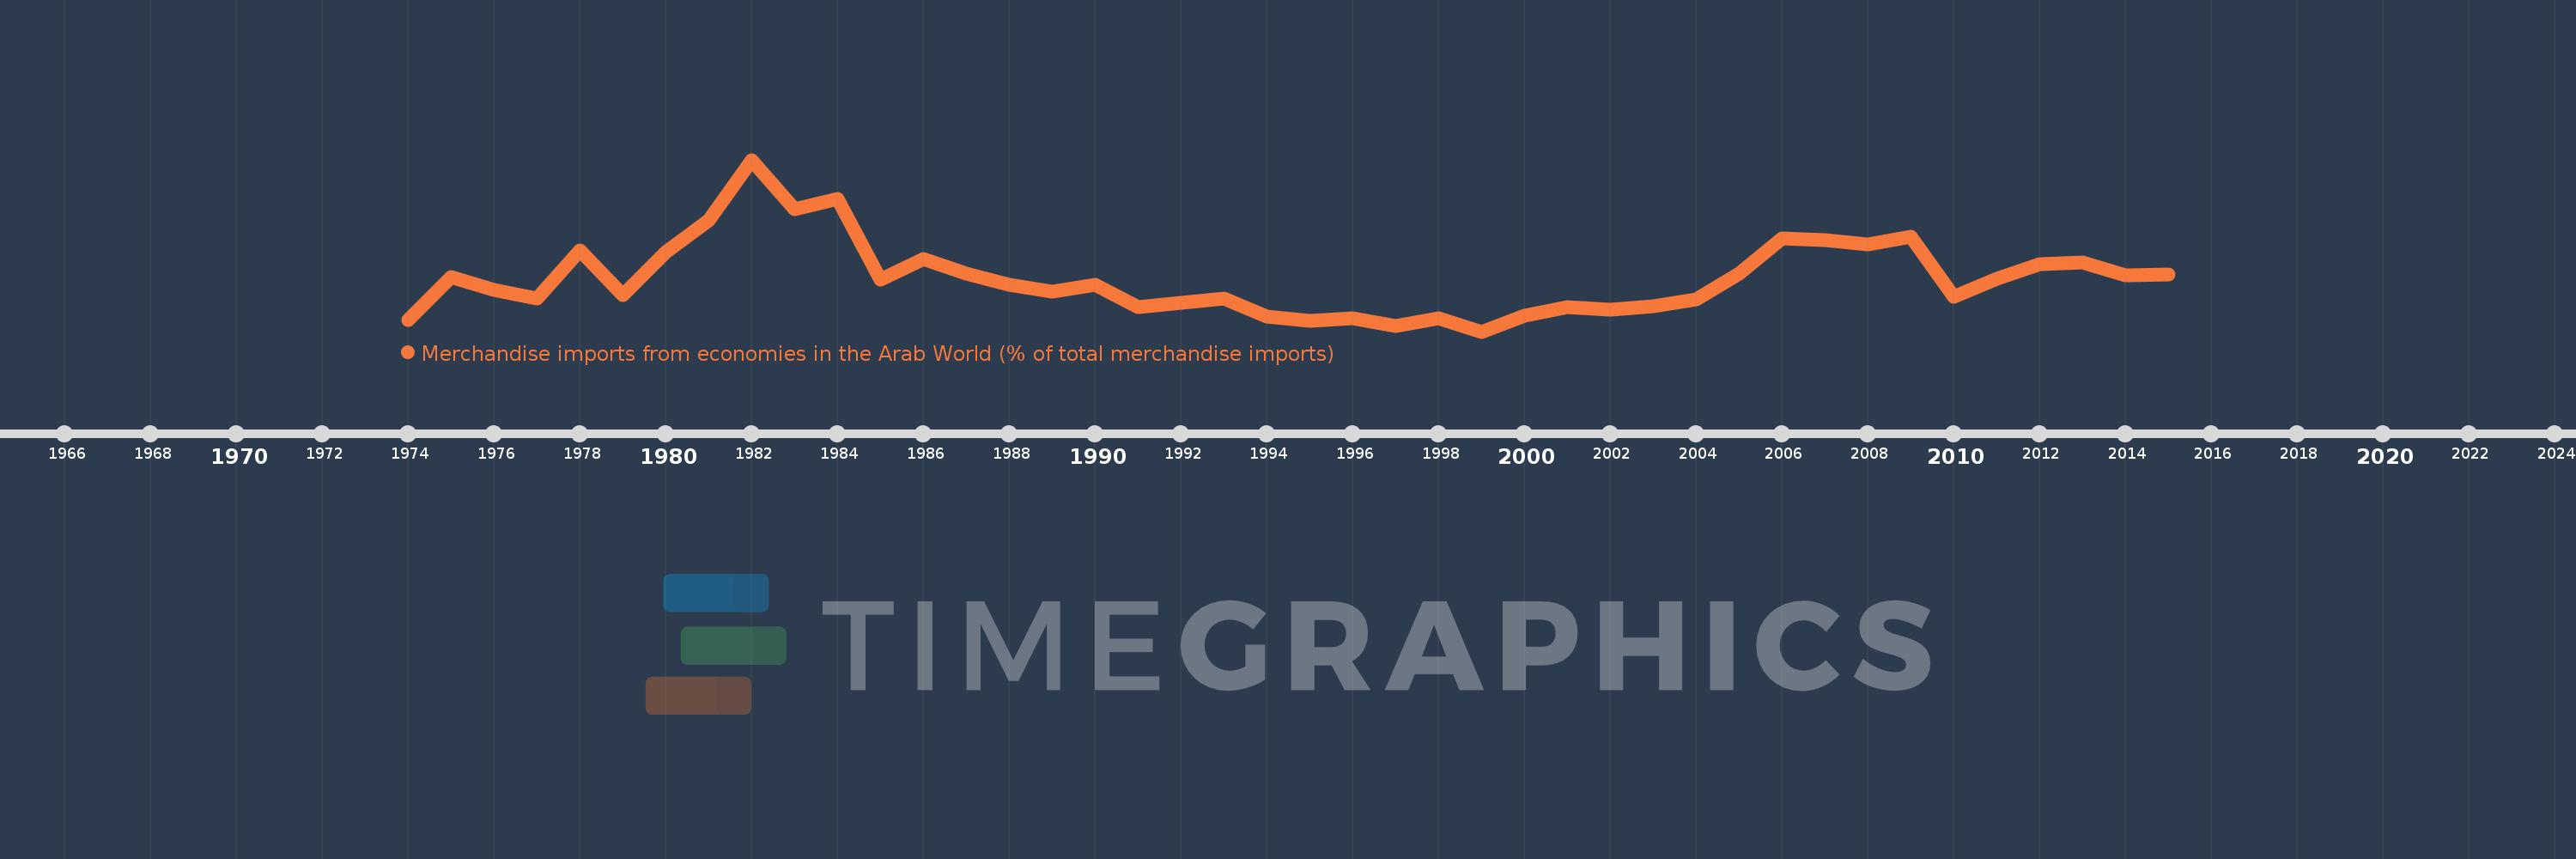
Merchandise imports from economies in the Arab World (% of total merchandise imports)
2015,2014,2013,2012,2011,2010,2009,2008,2007,2006,2005,2004,2003,2002,2001,2000,1999,1998,1997,1996,1995,1994,1993,1992,1991,1990,1989,1988,1987,1986,1985,1984,1983,1982,1981,1980,1979,1978,1977,1976,1975,1974
This statistics in other country:
AfghanistanAlbaniaAlgeriaAngolaArab WorldArgentinaArmeniaArubaAustraliaAustriaAzerbaijanBahamas, TheBahrainBangladeshBarbadosBelarusBelgiumBelizeBeninBermudaBoliviaBrazilBrunei DarussalamBulgariaBurkina FasoBurundiCabo VerdeCambodiaCameroonCanadaCaribbean small statesCentral African RepublicCentral Europe and the BalticsChadChileChinaColombiaComorosCongo, Dem. Rep.Congo, Rep.Costa RicaCote d'IvoireCroatiaCubaCyprusCzech RepublicDenmarkDjiboutiDominicaDominican RepublicEarly-demographic dividendEast Asia & PacificEast Asia & Pacific (excluding high income)East Asia & Pacific (IDA & IBRD countries)EcuadorEgypt, Arab Rep.El SalvadorEstoniaEthiopiaEuro areaEurope & Central AsiaEurope & Central Asia (excluding high income)Europe & Central Asia (IDA & IBRD countries)European UnionFijiFinlandFragile and conflict affected situationsFranceFrench PolynesiaGabonGambia, TheGeorgiaGermanyGhanaGreeceGreenlandGrenadaGuatemalaGuineaGuinea-BissauGuyanaHaitiHeavily indebted poor countries (HIPC)High incomeHondurasHong Kong SAR, ChinaHungaryIBRD onlyIcelandIDA & IBRD totalIDA blendIDA onlyIDA totalIndiaIndonesiaIran, Islamic Rep.IraqIrelandItalyJamaicaJapanJordanKazakhstanKenyaKorea, Dem. People’s Rep.Korea, Rep.KuwaitKyrgyz RepublicLao PDRLate-demographic dividendLatin America & Caribbean Latin America & Caribbean (excluding high income)Latin America & the Caribbean (IDA & IBRD countries)LatviaLeast developed countries: UN classificationLebanonLiberiaLibyaLithuaniaLow & middle incomeLow incomeLower middle incomeLuxembourgMacao SAR, ChinaMacedonia, FYRMadagascarMalawiMalaysiaMaldivesMaliMaltaMauritaniaMauritiusMexicoMiddle East & North AfricaMiddle East & North Africa (excluding high income)Middle East & North Africa (IDA & IBRD countries)Middle incomeMoldovaMongoliaMontenegroMoroccoMozambiqueMyanmarNepalNetherlandsNew CaledoniaNew ZealandNicaraguaNigerNigeriaNorth AmericaNorwayOECD membersOmanOther small statesPacific island small statesPakistanPanamaPapua New GuineaParaguayPeruPhilippinesPolandPortugalPost-demographic dividendPre-demographic dividendQatarRomaniaRussian FederationRwandaSaudi ArabiaSenegalSerbiaSeychellesSierra LeoneSingaporeSlovak RepublicSloveniaSmall statesSomaliaSouth AfricaSouth AsiaSouth Asia (IDA & IBRD)SpainSri LankaSt. LuciaSt. Vincent and the GrenadinesSub-Saharan Africa Sub-Saharan Africa (excluding high income)Sub-Saharan Africa (IDA & IBRD countries)SudanSurinameSwedenSwitzerlandSyrian Arab RepublicTajikistanTanzaniaThailandTogoTrinidad and TobagoTunisiaTurkeyTurkmenistanUgandaUkraineUnited Arab EmiratesUnited KingdomUnited StatesUpper middle incomeUruguayVenezuela, RBVietnamWorldYemen, Rep.ZambiaZimbabwe Timeline:
This timeline shows a graph from 1974 to 2015 of Bangladesh. No data until 1973. Number of actual observations by date: 42.
Source name:
World Development Indicators
Source organization:
World Bank staff estimates based data from International Monetary Fund's Direction of Trade database.
Categories, topics:
Private Sector, Trade
Last updated:
apr 23, 2017
Indicators value changes by year
Maximum:
23.196
jan 1, 1982
At the date of observation
Value
Absolute change
Change from previous value
jan 1, 1974
3.428
+3.428
0.0%
jan 1, 1975
8.748
+5.32
155.18%
jan 1, 1976
7.202
-1.545
-17.67%
jan 1, 1977
6.158
-1.044
-14.5%
jan 1, 1978
11.986
+5.827
94.62%
jan 1, 1979
6.504
-5.481
-45.73%
jan 1, 1980
11.875
+5.371
82.57%
jan 1, 1981
15.696
+3.821
32.18%
jan 1, 1982
23.196
+7.5
47.78%
jan 1, 1983
17.124
-6.072
-26.18%
jan 1, 1984
18.401
+1.277
7.46%
jan 1, 1985
8.39
-10.011
-54.4%
jan 1, 1986
10.928
+2.538
30.25%
jan 1, 1987
9.151
-1.777
-16.26%
jan 1, 1988
7.829
-1.322
-14.45%
jan 1, 1989
6.909
-0.92
-11.75%
jan 1, 1990
7.767
+0.859
12.43%
jan 1, 1991
5.031
-2.736
-35.23%
jan 1, 1992
5.551
+0.52
10.33%
jan 1, 1993
6.155
+0.605
10.9%
jan 1, 1994
3.942
-2.214
-35.96%
jan 1, 1995
3.325
-0.617
-15.65%
jan 1, 1996
3.663
+0.338
10.16%
jan 1, 1997
2.741
-0.922
-25.18%
jan 1, 1998
3.726
+0.986
35.97%
jan 1, 1999
2.044
-1.683
-45.15%
jan 1, 2000
3.96
+1.917
93.77%
jan 1, 2001
5.082
+1.122
28.33%
jan 1, 2002
4.744
-0.339
-6.66%
jan 1, 2003
5.113
+0.369
7.78%
jan 1, 2004
6.012
+0.899
17.58%
jan 1, 2005
9.131
+3.119
51.88%
jan 1, 2006
13.563
+4.432
48.54%
jan 1, 2007
13.3
-0.264
-1.94%
jan 1, 2008
12.758
-0.542
-4.08%
jan 1, 2009
13.693
+0.936
7.34%
jan 1, 2010
6.335
-7.359
-53.74%
jan 1, 2011
8.57
+2.236
35.3%
jan 1, 2012
10.366
+1.796
20.96%
jan 1, 2013
10.54
+0.174
1.68%
jan 1, 2014
8.973
-1.567
-14.87%
jan 1, 2015
9.04
+0.067
0.75%
Ranking of countries by current statistics by years


Comments: