29
/
en
AIzaSyAYiBZKx7MnpbEhh9jyipgxe19OcubqV5w
April 1, 2024
31825
Europe & Central Asia (excluding high income)
ECA
false
2
1
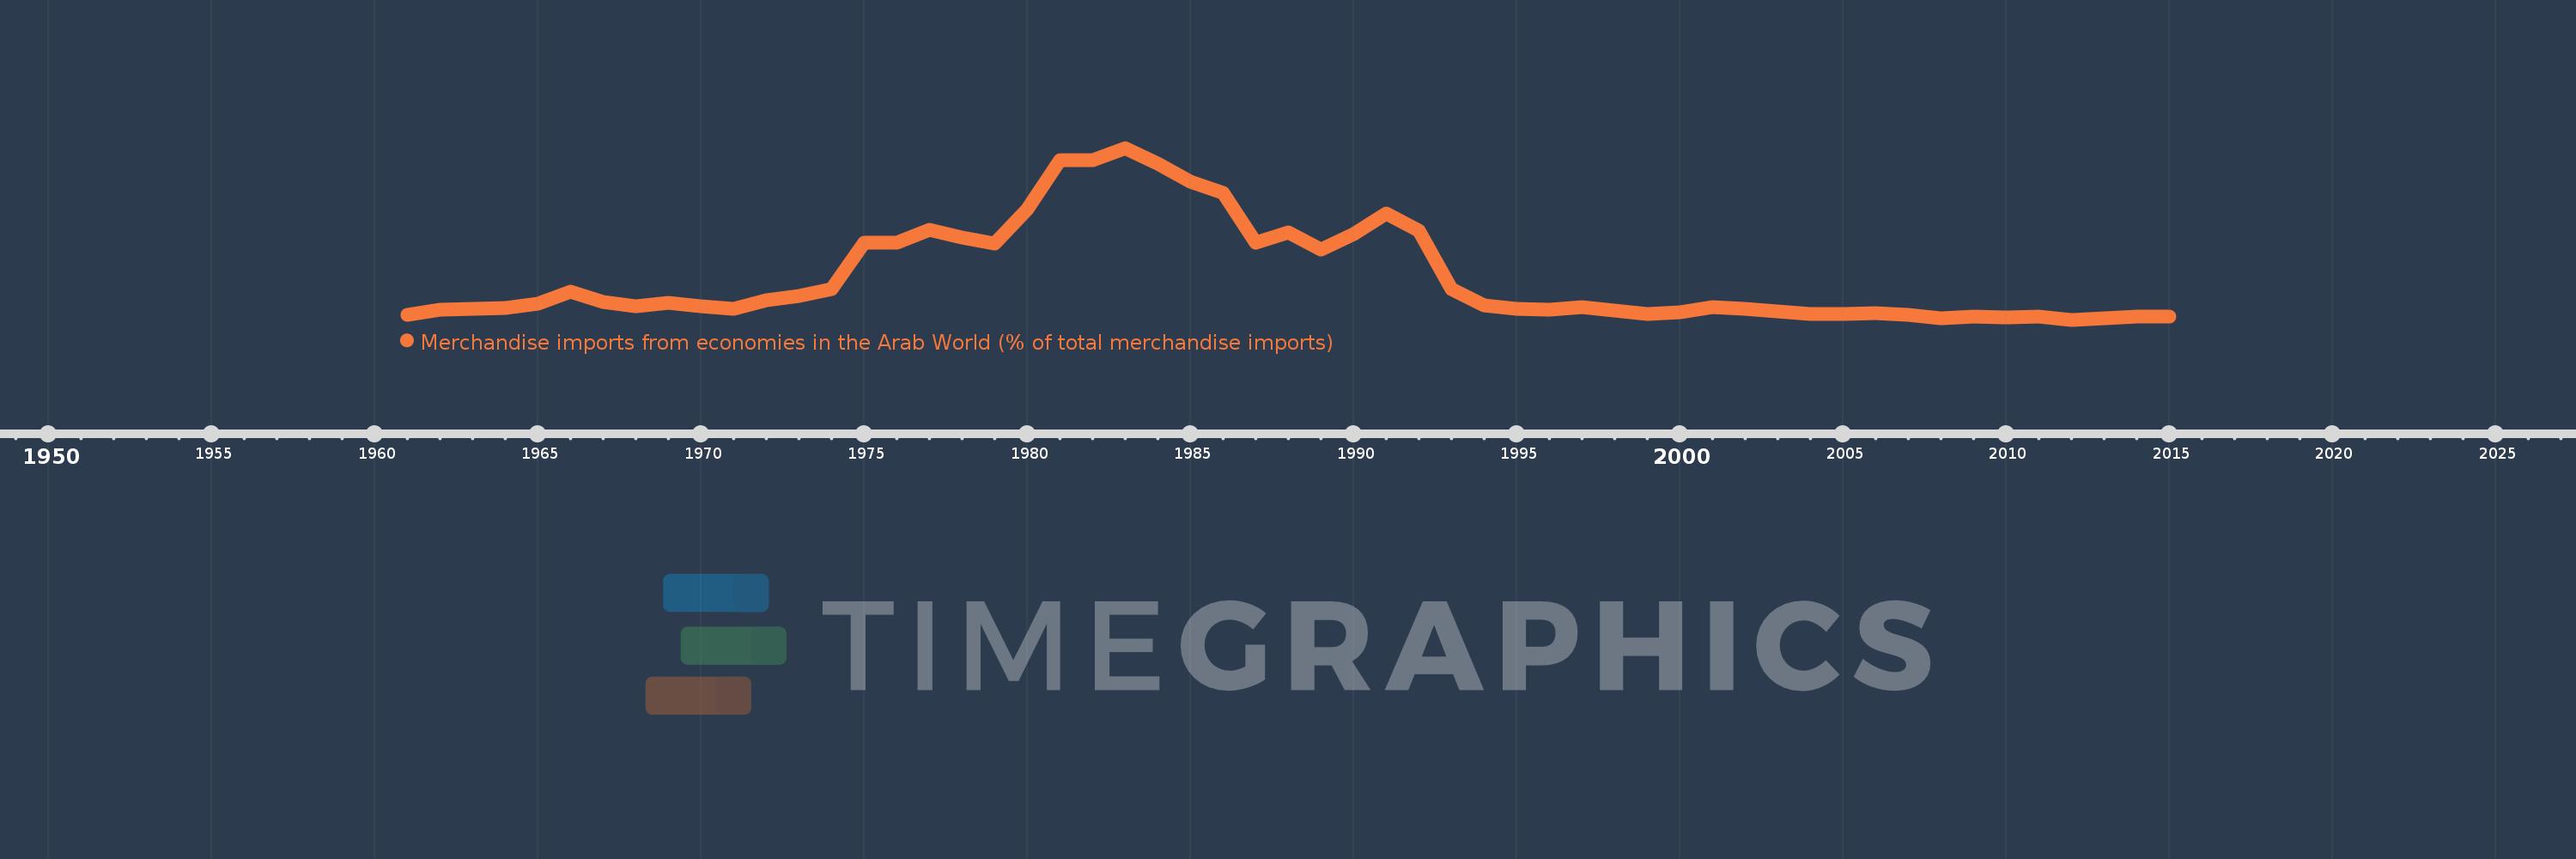
Merchandise imports from economies in the Arab World (% of total merchandise imports)
2015,2014,2013,2012,2011,2010,2009,2008,2007,2006,2005,2004,2003,2002,2001,2000,1999,1998,1997,1996,1995,1994,1993,1992,1991,1990,1989,1988,1987,1986,1985,1984,1983,1982,1981,1980,1979,1978,1977,1976,1975,1974,1973,1972,1971,1970,1969,1968,1967,1966,1965,1964,1963,1962,1961
This statistics in other country:
AfghanistanAlbaniaAlgeriaAngolaArab WorldArgentinaArmeniaArubaAustraliaAustriaAzerbaijanBahamas, TheBahrainBangladeshBarbadosBelarusBelgiumBelizeBeninBermudaBoliviaBrazilBrunei DarussalamBulgariaBurkina FasoBurundiCabo VerdeCambodiaCameroonCanadaCaribbean small statesCentral African RepublicCentral Europe and the BalticsChadChileChinaColombiaComorosCongo, Dem. Rep.Congo, Rep.Costa RicaCote d'IvoireCroatiaCubaCyprusCzech RepublicDenmarkDjiboutiDominicaDominican RepublicEarly-demographic dividendEast Asia & PacificEast Asia & Pacific (excluding high income)East Asia & Pacific (IDA & IBRD countries)EcuadorEgypt, Arab Rep.El SalvadorEstoniaEthiopiaEuro areaEurope & Central AsiaEurope & Central Asia (excluding high income)Europe & Central Asia (IDA & IBRD countries)European UnionFijiFinlandFragile and conflict affected situationsFranceFrench PolynesiaGabonGambia, TheGeorgiaGermanyGhanaGreeceGreenlandGrenadaGuatemalaGuineaGuinea-BissauGuyanaHaitiHeavily indebted poor countries (HIPC)High incomeHondurasHong Kong SAR, ChinaHungaryIBRD onlyIcelandIDA & IBRD totalIDA blendIDA onlyIDA totalIndiaIndonesiaIran, Islamic Rep.IraqIrelandItalyJamaicaJapanJordanKazakhstanKenyaKorea, Dem. People’s Rep.Korea, Rep.KuwaitKyrgyz RepublicLao PDRLate-demographic dividendLatin America & Caribbean Latin America & Caribbean (excluding high income)Latin America & the Caribbean (IDA & IBRD countries)LatviaLeast developed countries: UN classificationLebanonLiberiaLibyaLithuaniaLow & middle incomeLow incomeLower middle incomeLuxembourgMacao SAR, ChinaMacedonia, FYRMadagascarMalawiMalaysiaMaldivesMaliMaltaMauritaniaMauritiusMexicoMiddle East & North AfricaMiddle East & North Africa (excluding high income)Middle East & North Africa (IDA & IBRD countries)Middle incomeMoldovaMongoliaMontenegroMoroccoMozambiqueMyanmarNepalNetherlandsNew CaledoniaNew ZealandNicaraguaNigerNigeriaNorth AmericaNorwayOECD membersOmanOther small statesPacific island small statesPakistanPanamaPapua New GuineaParaguayPeruPhilippinesPolandPortugalPost-demographic dividendPre-demographic dividendQatarRomaniaRussian FederationRwandaSaudi ArabiaSenegalSerbiaSeychellesSierra LeoneSingaporeSlovak RepublicSloveniaSmall statesSomaliaSouth AfricaSouth AsiaSouth Asia (IDA & IBRD)SpainSri LankaSt. LuciaSt. Vincent and the GrenadinesSub-Saharan Africa Sub-Saharan Africa (excluding high income)Sub-Saharan Africa (IDA & IBRD countries)SudanSurinameSwedenSwitzerlandSyrian Arab RepublicTajikistanTanzaniaThailandTogoTrinidad and TobagoTunisiaTurkeyTurkmenistanUgandaUkraineUnited Arab EmiratesUnited KingdomUnited StatesUpper middle incomeUruguayVenezuela, RBVietnamWorldYemen, Rep.ZambiaZimbabwe Timeline:
This timeline shows a graph from 1961 to 2015 of Europe & Central Asia (excluding high income). No data until 1960. Number of actual observations by date: 55.
Source name:
World Development Indicators
Source organization:
World Bank staff estimates based data from International Monetary Fund's Direction of Trade database.
Categories, topics:
Private Sector, Trade
Last updated:
apr 23, 2017
Indicators value changes by year
Maximum:
23.049
jan 1, 1983
At the date of observation
Value
Absolute change
Change from previous value
jan 1, 1961
2.148
+2.148
0.0%
jan 1, 1962
2.719
+0.571
26.61%
jan 1, 1963
2.892
+0.173
6.35%
jan 1, 1964
2.937
+0.046
1.58%
jan 1, 1965
3.483
+0.545
18.56%
jan 1, 1966
4.992
+1.509
43.34%
jan 1, 1967
3.741
-1.251
-25.07%
jan 1, 1968
3.205
-0.536
-14.32%
jan 1, 1969
3.648
+0.443
13.81%
jan 1, 1970
3.154
-0.493
-13.53%
jan 1, 1971
2.828
-0.326
-10.34%
jan 1, 1972
3.983
+1.155
40.85%
jan 1, 1973
4.518
+0.534
13.41%
jan 1, 1974
5.349
+0.832
18.41%
jan 1, 1975
11.193
+5.844
109.24%
jan 1, 1976
11.211
+0.018
0.16%
jan 1, 1977
12.823
+1.611
14.37%
jan 1, 1978
11.776
-1.046
-8.16%
jan 1, 1979
11.067
-0.71
-6.03%
jan 1, 1980
15.409
+4.343
39.24%
jan 1, 1981
21.5
+6.091
39.53%
jan 1, 1982
21.469
-0.032
-0.15%
jan 1, 1983
23.049
+1.58
7.36%
jan 1, 1984
21.131
-1.917
-8.32%
jan 1, 1985
18.764
-2.367
-11.2%
jan 1, 1986
17.426
-1.338
-7.13%
jan 1, 1987
11.117
-6.309
-36.21%
jan 1, 1988
12.475
+1.358
12.22%
jan 1, 1989
10.341
-2.134
-17.11%
jan 1, 1990
12.293
+1.952
18.88%
jan 1, 1991
14.87
+2.577
20.96%
jan 1, 1992
12.645
-2.225
-14.96%
jan 1, 1993
5.398
-7.247
-57.31%
jan 1, 1994
3.271
-2.127
-39.4%
jan 1, 1995
2.902
-0.369
-11.29%
jan 1, 1996
2.807
-0.095
-3.26%
jan 1, 1997
3.056
+0.248
8.85%
jan 1, 1998
2.626
-0.429
-14.06%
jan 1, 1999
2.274
-0.352
-13.4%
jan 1, 2000
2.467
+0.193
8.47%
jan 1, 2001
3.079
+0.612
24.79%
jan 1, 2002
2.878
-0.2
-6.5%
jan 1, 2003
2.565
-0.313
-10.89%
jan 1, 2004
2.236
-0.329
-12.84%
jan 1, 2005
2.235
0.0
-0.01%
jan 1, 2006
2.323
+0.088
3.92%
jan 1, 2007
2.132
-0.191
-8.22%
jan 1, 2008
1.633
-0.499
-23.39%
jan 1, 2009
1.907
+0.273
16.72%
jan 1, 2010
1.844
-0.063
-3.28%
jan 1, 2011
1.951
+0.107
5.83%
jan 1, 2012
1.5
-0.452
-23.14%
jan 1, 2013
1.678
+0.178
11.88%
jan 1, 2014
1.878
+0.2
11.91%
jan 1, 2015
1.847
-0.031
-1.63%
Ranking of countries by current statistics by years


Comments: