29
/
en
AIzaSyAYiBZKx7MnpbEhh9jyipgxe19OcubqV5w
April 1, 2024
223863
Philippines
PHL
true
2
1
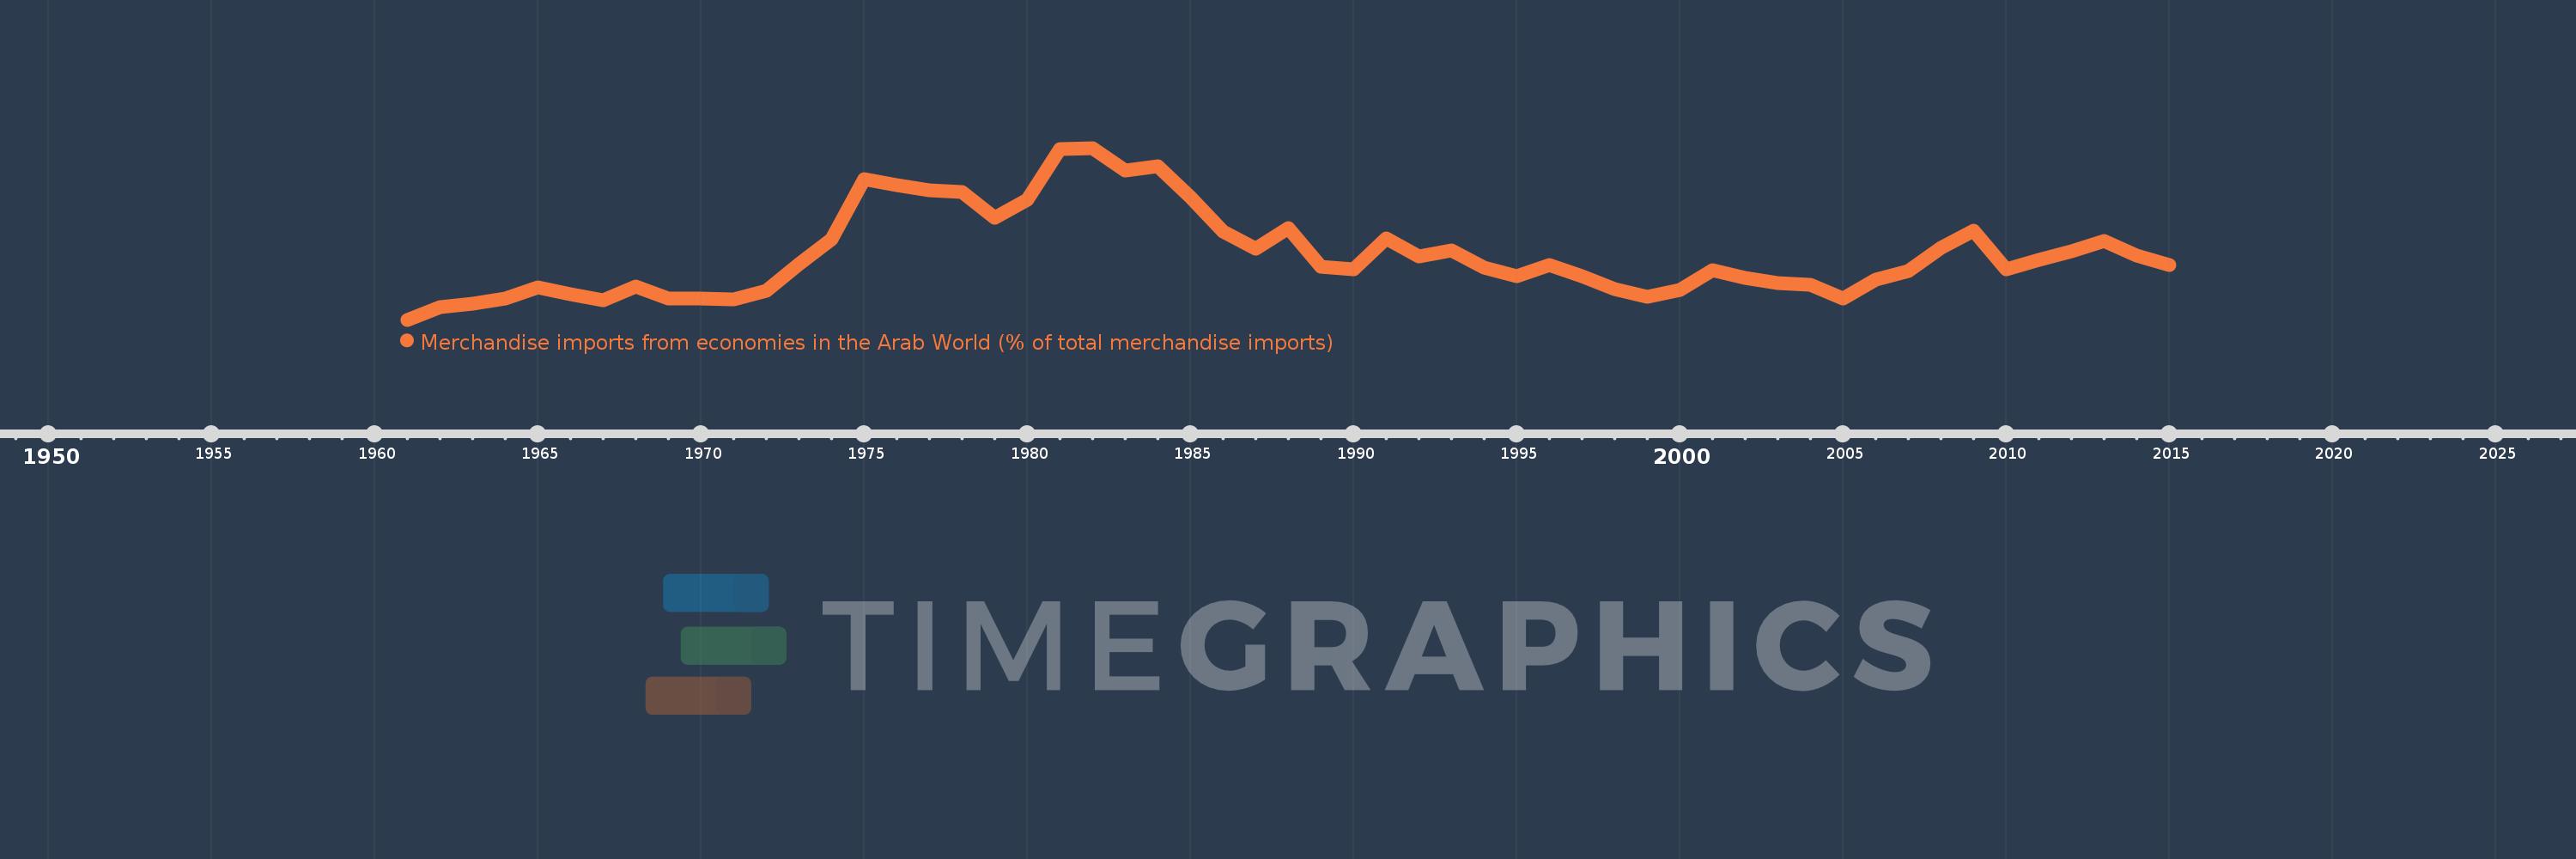
Merchandise imports from economies in the Arab World (% of total merchandise imports)
2015,2014,2013,2012,2011,2010,2009,2008,2007,2006,2005,2004,2003,2002,2001,2000,1999,1998,1997,1996,1995,1994,1993,1992,1991,1990,1989,1988,1987,1986,1985,1984,1983,1982,1981,1980,1979,1978,1977,1976,1975,1974,1973,1972,1971,1970,1969,1968,1967,1966,1965,1964,1963,1962,1961
This statistics in other country:
AfghanistanAlbaniaAlgeriaAngolaArab WorldArgentinaArmeniaArubaAustraliaAustriaAzerbaijanBahamas, TheBahrainBangladeshBarbadosBelarusBelgiumBelizeBeninBermudaBoliviaBrazilBrunei DarussalamBulgariaBurkina FasoBurundiCabo VerdeCambodiaCameroonCanadaCaribbean small statesCentral African RepublicCentral Europe and the BalticsChadChileChinaColombiaComorosCongo, Dem. Rep.Congo, Rep.Costa RicaCote d'IvoireCroatiaCubaCyprusCzech RepublicDenmarkDjiboutiDominicaDominican RepublicEarly-demographic dividendEast Asia & PacificEast Asia & Pacific (excluding high income)East Asia & Pacific (IDA & IBRD countries)EcuadorEgypt, Arab Rep.El SalvadorEstoniaEthiopiaEuro areaEurope & Central AsiaEurope & Central Asia (excluding high income)Europe & Central Asia (IDA & IBRD countries)European UnionFijiFinlandFragile and conflict affected situationsFranceFrench PolynesiaGabonGambia, TheGeorgiaGermanyGhanaGreeceGreenlandGrenadaGuatemalaGuineaGuinea-BissauGuyanaHaitiHeavily indebted poor countries (HIPC)High incomeHondurasHong Kong SAR, ChinaHungaryIBRD onlyIcelandIDA & IBRD totalIDA blendIDA onlyIDA totalIndiaIndonesiaIran, Islamic Rep.IraqIrelandItalyJamaicaJapanJordanKazakhstanKenyaKorea, Dem. People’s Rep.Korea, Rep.KuwaitKyrgyz RepublicLao PDRLate-demographic dividendLatin America & Caribbean Latin America & Caribbean (excluding high income)Latin America & the Caribbean (IDA & IBRD countries)LatviaLeast developed countries: UN classificationLebanonLiberiaLibyaLithuaniaLow & middle incomeLow incomeLower middle incomeLuxembourgMacao SAR, ChinaMacedonia, FYRMadagascarMalawiMalaysiaMaldivesMaliMaltaMauritaniaMauritiusMexicoMiddle East & North AfricaMiddle East & North Africa (excluding high income)Middle East & North Africa (IDA & IBRD countries)Middle incomeMoldovaMongoliaMontenegroMoroccoMozambiqueMyanmarNepalNetherlandsNew CaledoniaNew ZealandNicaraguaNigerNigeriaNorth AmericaNorwayOECD membersOmanOther small statesPacific island small statesPakistanPanamaPapua New GuineaParaguayPeruPhilippinesPolandPortugalPost-demographic dividendPre-demographic dividendQatarRomaniaRussian FederationRwandaSaudi ArabiaSenegalSerbiaSeychellesSierra LeoneSingaporeSlovak RepublicSloveniaSmall statesSomaliaSouth AfricaSouth AsiaSouth Asia (IDA & IBRD)SpainSri LankaSt. LuciaSt. Vincent and the GrenadinesSub-Saharan Africa Sub-Saharan Africa (excluding high income)Sub-Saharan Africa (IDA & IBRD countries)SudanSurinameSwedenSwitzerlandSyrian Arab RepublicTajikistanTanzaniaThailandTogoTrinidad and TobagoTunisiaTurkeyTurkmenistanUgandaUkraineUnited Arab EmiratesUnited KingdomUnited StatesUpper middle incomeUruguayVenezuela, RBVietnamWorldYemen, Rep.ZambiaZimbabwe Timeline:
This timeline shows a graph from 1961 to 2015 of Philippines. No data until 1960. Number of actual observations by date: 55.
Source name:
World Development Indicators
Source organization:
World Bank staff estimates based data from International Monetary Fund's Direction of Trade database.
Categories, topics:
Private Sector, Trade
Last updated:
apr 23, 2017
Indicators value changes by year
At the date of observation
Value
Absolute change
Change from previous value
jan 1, 1961
1.177
+1.177
0.0%
jan 1, 1962
2.648
+1.472
125.07%
jan 1, 1963
3.031
+0.382
14.44%
jan 1, 1964
3.578
+0.547
18.05%
jan 1, 1965
4.805
+1.227
34.29%
jan 1, 1966
4.092
-0.713
-14.84%
jan 1, 1967
3.366
-0.726
-17.74%
jan 1, 1968
4.938
+1.572
46.69%
jan 1, 1969
3.576
-1.361
-27.57%
jan 1, 1970
3.631
+0.054
1.52%
jan 1, 1971
3.445
-0.186
-5.12%
jan 1, 1972
4.436
+0.99
28.75%
jan 1, 1973
7.48
+3.044
68.63%
jan 1, 1974
10.315
+2.835
37.9%
jan 1, 1975
17.137
+6.822
66.14%
jan 1, 1976
16.431
-0.706
-4.12%
jan 1, 1977
15.82
-0.611
-3.72%
jan 1, 1978
15.629
-0.191
-1.21%
jan 1, 1979
12.714
-2.915
-18.65%
jan 1, 1980
14.746
+2.031
15.98%
jan 1, 1981
20.491
+5.745
38.96%
jan 1, 1982
20.66
+0.169
0.83%
jan 1, 1983
18.115
-2.546
-12.32%
jan 1, 1984
18.555
+0.441
2.43%
jan 1, 1985
15.051
-3.504
-18.88%
jan 1, 1986
11.196
-3.855
-25.61%
jan 1, 1987
9.196
-2.0
-17.87%
jan 1, 1988
11.605
+2.409
26.2%
jan 1, 1989
7.158
-4.447
-38.32%
jan 1, 1990
6.891
-0.267
-3.72%
jan 1, 1991
10.437
+3.546
51.46%
jan 1, 1992
8.343
-2.094
-20.06%
jan 1, 1993
9.001
+0.659
7.89%
jan 1, 1994
7.105
-1.896
-21.07%
jan 1, 1995
6.11
-0.995
-14.01%
jan 1, 1996
7.425
+1.315
21.53%
jan 1, 1997
6.116
-1.309
-17.63%
jan 1, 1998
4.645
-1.471
-24.05%
jan 1, 1999
3.764
-0.88
-18.96%
jan 1, 2000
4.538
+0.774
20.55%
jan 1, 2001
6.81
+2.272
50.07%
jan 1, 2002
5.906
-0.904
-13.28%
jan 1, 2003
5.294
-0.612
-10.35%
jan 1, 2004
5.157
-0.137
-2.59%
jan 1, 2005
3.555
-1.602
-31.06%
jan 1, 2006
5.735
+2.18
61.32%
jan 1, 2007
6.706
+0.97
16.92%
jan 1, 2008
9.341
+2.636
39.31%
jan 1, 2009
11.311
+1.97
21.08%
jan 1, 2010
6.854
-4.457
-39.4%
jan 1, 2011
7.965
+1.111
16.21%
jan 1, 2012
8.989
+1.024
12.86%
jan 1, 2013
10.088
+1.099
12.23%
jan 1, 2014
8.447
-1.641
-16.26%
jan 1, 2015
7.428
-1.019
-12.06%
Ranking of countries by current statistics by years


Comments: