29
/
en
AIzaSyAYiBZKx7MnpbEhh9jyipgxe19OcubqV5w
April 1, 2024
57290
South Asia
SAS
false
2
1
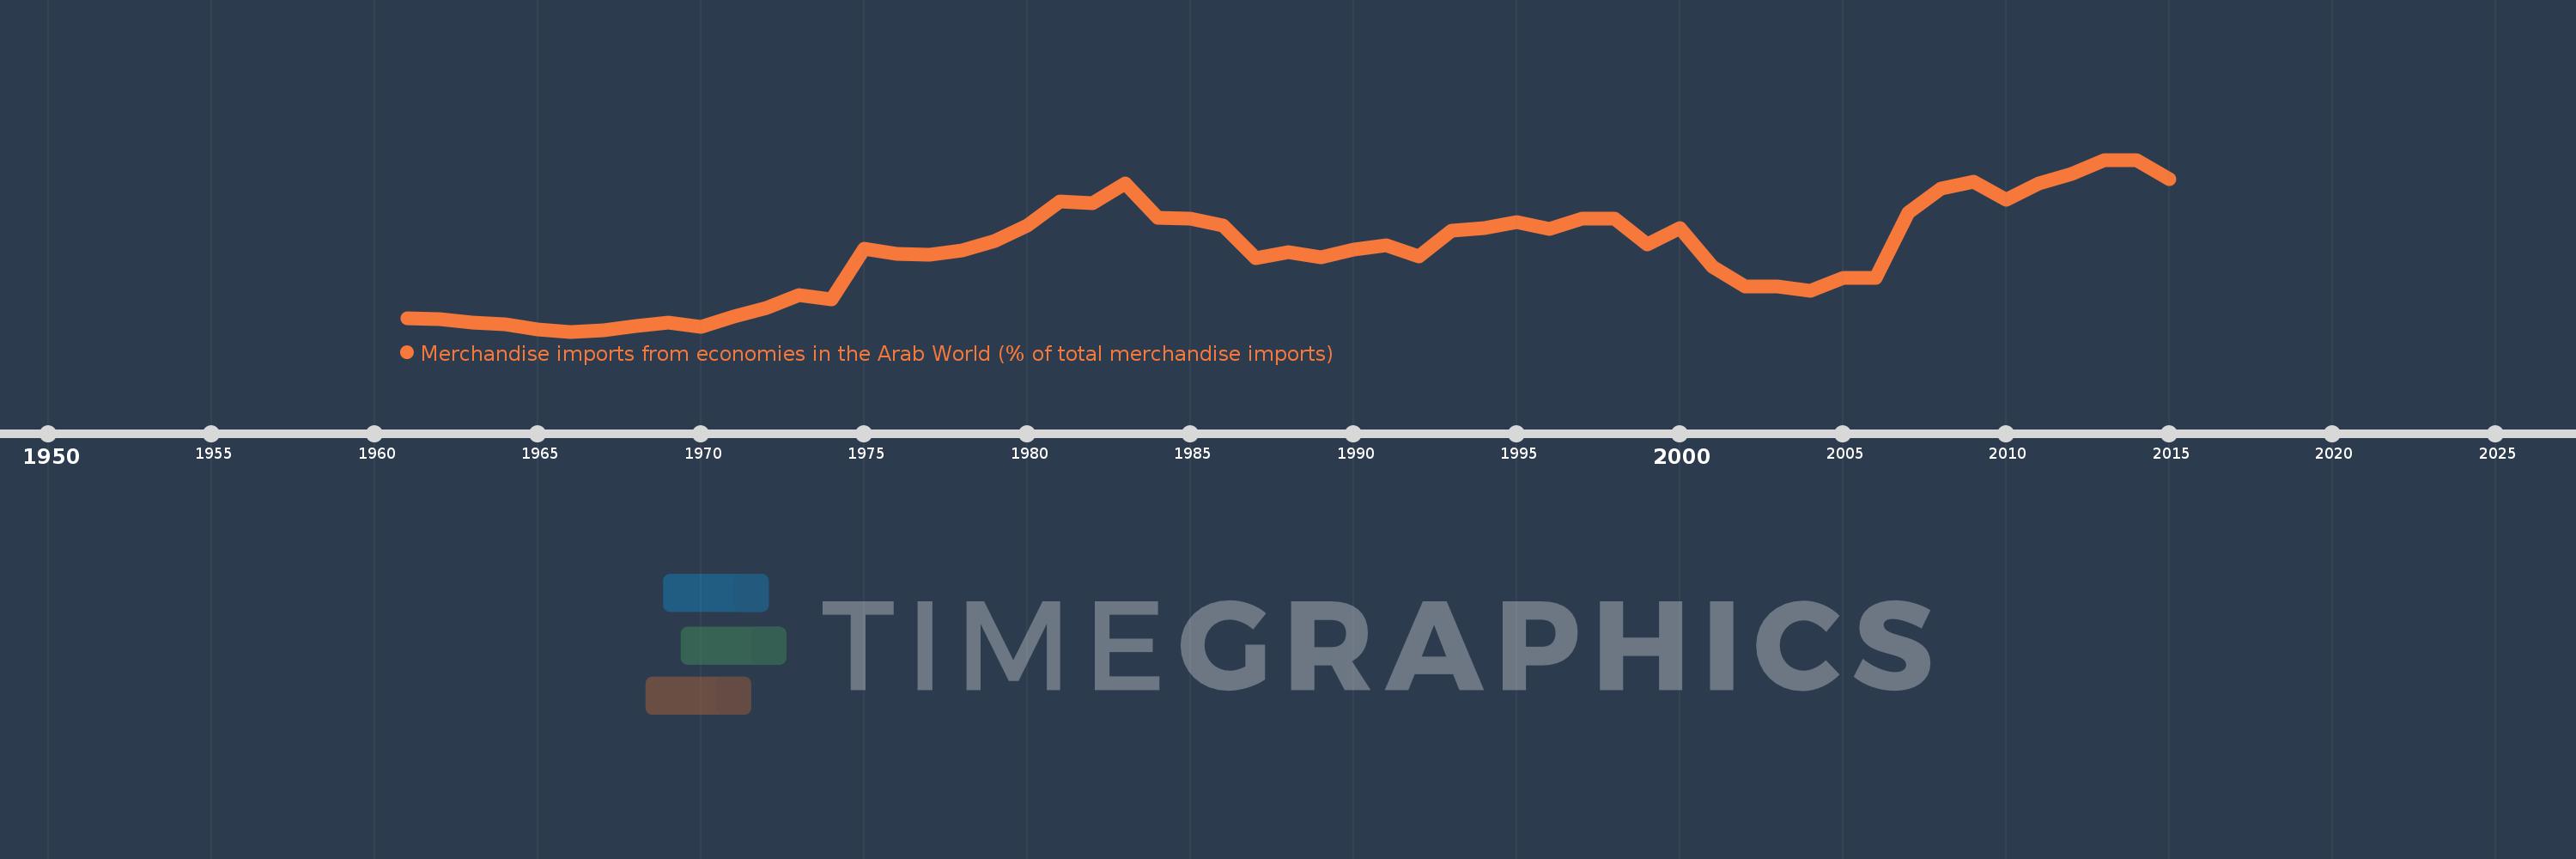
Merchandise imports from economies in the Arab World (% of total merchandise imports)
2015,2014,2013,2012,2011,2010,2009,2008,2007,2006,2005,2004,2003,2002,2001,2000,1999,1998,1997,1996,1995,1994,1993,1992,1991,1990,1989,1988,1987,1986,1985,1984,1983,1982,1981,1980,1979,1978,1977,1976,1975,1974,1973,1972,1971,1970,1969,1968,1967,1966,1965,1964,1963,1962,1961
This statistics in other country:
AfghanistanAlbaniaAlgeriaAngolaArab WorldArgentinaArmeniaArubaAustraliaAustriaAzerbaijanBahamas, TheBahrainBangladeshBarbadosBelarusBelgiumBelizeBeninBermudaBoliviaBrazilBrunei DarussalamBulgariaBurkina FasoBurundiCabo VerdeCambodiaCameroonCanadaCaribbean small statesCentral African RepublicCentral Europe and the BalticsChadChileChinaColombiaComorosCongo, Dem. Rep.Congo, Rep.Costa RicaCote d'IvoireCroatiaCubaCyprusCzech RepublicDenmarkDjiboutiDominicaDominican RepublicEarly-demographic dividendEast Asia & PacificEast Asia & Pacific (excluding high income)East Asia & Pacific (IDA & IBRD countries)EcuadorEgypt, Arab Rep.El SalvadorEstoniaEthiopiaEuro areaEurope & Central AsiaEurope & Central Asia (excluding high income)Europe & Central Asia (IDA & IBRD countries)European UnionFijiFinlandFragile and conflict affected situationsFranceFrench PolynesiaGabonGambia, TheGeorgiaGermanyGhanaGreeceGreenlandGrenadaGuatemalaGuineaGuinea-BissauGuyanaHaitiHeavily indebted poor countries (HIPC)High incomeHondurasHong Kong SAR, ChinaHungaryIBRD onlyIcelandIDA & IBRD totalIDA blendIDA onlyIDA totalIndiaIndonesiaIran, Islamic Rep.IraqIrelandItalyJamaicaJapanJordanKazakhstanKenyaKorea, Dem. People’s Rep.Korea, Rep.KuwaitKyrgyz RepublicLao PDRLate-demographic dividendLatin America & Caribbean Latin America & Caribbean (excluding high income)Latin America & the Caribbean (IDA & IBRD countries)LatviaLeast developed countries: UN classificationLebanonLiberiaLibyaLithuaniaLow & middle incomeLow incomeLower middle incomeLuxembourgMacao SAR, ChinaMacedonia, FYRMadagascarMalawiMalaysiaMaldivesMaliMaltaMauritaniaMauritiusMexicoMiddle East & North AfricaMiddle East & North Africa (excluding high income)Middle East & North Africa (IDA & IBRD countries)Middle incomeMoldovaMongoliaMontenegroMoroccoMozambiqueMyanmarNepalNetherlandsNew CaledoniaNew ZealandNicaraguaNigerNigeriaNorth AmericaNorwayOECD membersOmanOther small statesPacific island small statesPakistanPanamaPapua New GuineaParaguayPeruPhilippinesPolandPortugalPost-demographic dividendPre-demographic dividendQatarRomaniaRussian FederationRwandaSaudi ArabiaSenegalSerbiaSeychellesSierra LeoneSingaporeSlovak RepublicSloveniaSmall statesSomaliaSouth AfricaSouth AsiaSouth Asia (IDA & IBRD)SpainSri LankaSt. LuciaSt. Vincent and the GrenadinesSub-Saharan Africa Sub-Saharan Africa (excluding high income)Sub-Saharan Africa (IDA & IBRD countries)SudanSurinameSwedenSwitzerlandSyrian Arab RepublicTajikistanTanzaniaThailandTogoTrinidad and TobagoTunisiaTurkeyTurkmenistanUgandaUkraineUnited Arab EmiratesUnited KingdomUnited StatesUpper middle incomeUruguayVenezuela, RBVietnamWorldYemen, Rep.ZambiaZimbabwe Timeline:
This timeline shows a graph from 1961 to 2015 of South Asia. No data until 1960. Number of actual observations by date: 55.
Source name:
World Development Indicators
Source organization:
World Bank staff estimates based data from International Monetary Fund's Direction of Trade database.
Categories, topics:
Private Sector, Trade
Last updated:
apr 23, 2017
Indicators value changes by year
Maximum:
26.329
jan 1, 2013
At the date of observation
Value
Absolute change
Change from previous value
jan 1, 1961
4.182
+4.182
0.0%
jan 1, 1962
4.033
-0.15
-3.58%
jan 1, 1963
3.662
-0.371
-9.2%
jan 1, 1964
3.334
-0.328
-8.96%
jan 1, 1965
2.68
-0.653
-19.59%
jan 1, 1966
2.349
-0.332
-12.37%
jan 1, 1967
2.549
+0.2
8.52%
jan 1, 1968
3.117
+0.568
22.29%
jan 1, 1969
3.599
+0.482
15.47%
jan 1, 1970
3.026
-0.574
-15.94%
jan 1, 1971
4.456
+1.431
47.29%
jan 1, 1972
5.61
+1.154
25.9%
jan 1, 1973
7.429
+1.818
32.41%
jan 1, 1974
6.803
-0.626
-8.42%
jan 1, 1975
13.868
+7.065
103.85%
jan 1, 1976
13.215
-0.653
-4.71%
jan 1, 1977
13.138
-0.077
-0.58%
jan 1, 1978
13.644
+0.506
3.85%
jan 1, 1979
15.019
+1.375
10.08%
jan 1, 1980
17.196
+2.177
14.49%
jan 1, 1981
20.569
+3.372
19.61%
jan 1, 1982
20.265
-0.304
-1.48%
jan 1, 1983
23.041
+2.776
13.7%
jan 1, 1984
18.242
-4.799
-20.83%
jan 1, 1985
18.168
-0.074
-0.41%
jan 1, 1986
17.162
-1.006
-5.54%
jan 1, 1987
12.573
-4.589
-26.74%
jan 1, 1988
13.408
+0.836
6.65%
jan 1, 1989
12.678
-0.73
-5.45%
jan 1, 1990
13.843
+1.165
9.19%
jan 1, 1991
14.432
+0.589
4.26%
jan 1, 1992
12.897
-1.536
-10.64%
jan 1, 1993
16.467
+3.57
27.68%
jan 1, 1994
16.784
+0.317
1.93%
jan 1, 1995
17.622
+0.838
4.99%
jan 1, 1996
16.635
-0.987
-5.6%
jan 1, 1997
18.081
+1.446
8.69%
jan 1, 1998
18.171
+0.09
0.5%
jan 1, 1999
14.551
-3.62
-19.92%
jan 1, 2000
16.792
+2.241
15.4%
jan 1, 2001
11.375
-5.417
-32.26%
jan 1, 2002
8.649
-2.726
-23.96%
jan 1, 2003
8.663
+0.013
0.16%
jan 1, 2004
8.05
-0.612
-7.07%
jan 1, 2005
9.826
+1.775
22.05%
jan 1, 2006
9.805
-0.021
-0.21%
jan 1, 2007
18.928
+9.123
93.04%
jan 1, 2008
22.256
+3.328
17.58%
jan 1, 2009
23.252
+0.996
4.47%
jan 1, 2010
20.807
-2.444
-10.51%
jan 1, 2011
23.088
+2.28
10.96%
jan 1, 2012
24.342
+1.254
5.43%
jan 1, 2013
26.329
+1.987
8.16%
jan 1, 2014
26.318
-0.011
-0.04%
jan 1, 2015
23.608
-2.709
-10.29%
Ranking of countries by current statistics by years


Comments: