29
/
en
AIzaSyAYiBZKx7MnpbEhh9jyipgxe19OcubqV5w
April 1, 2024
33640
European Union
EUU
false
2
1
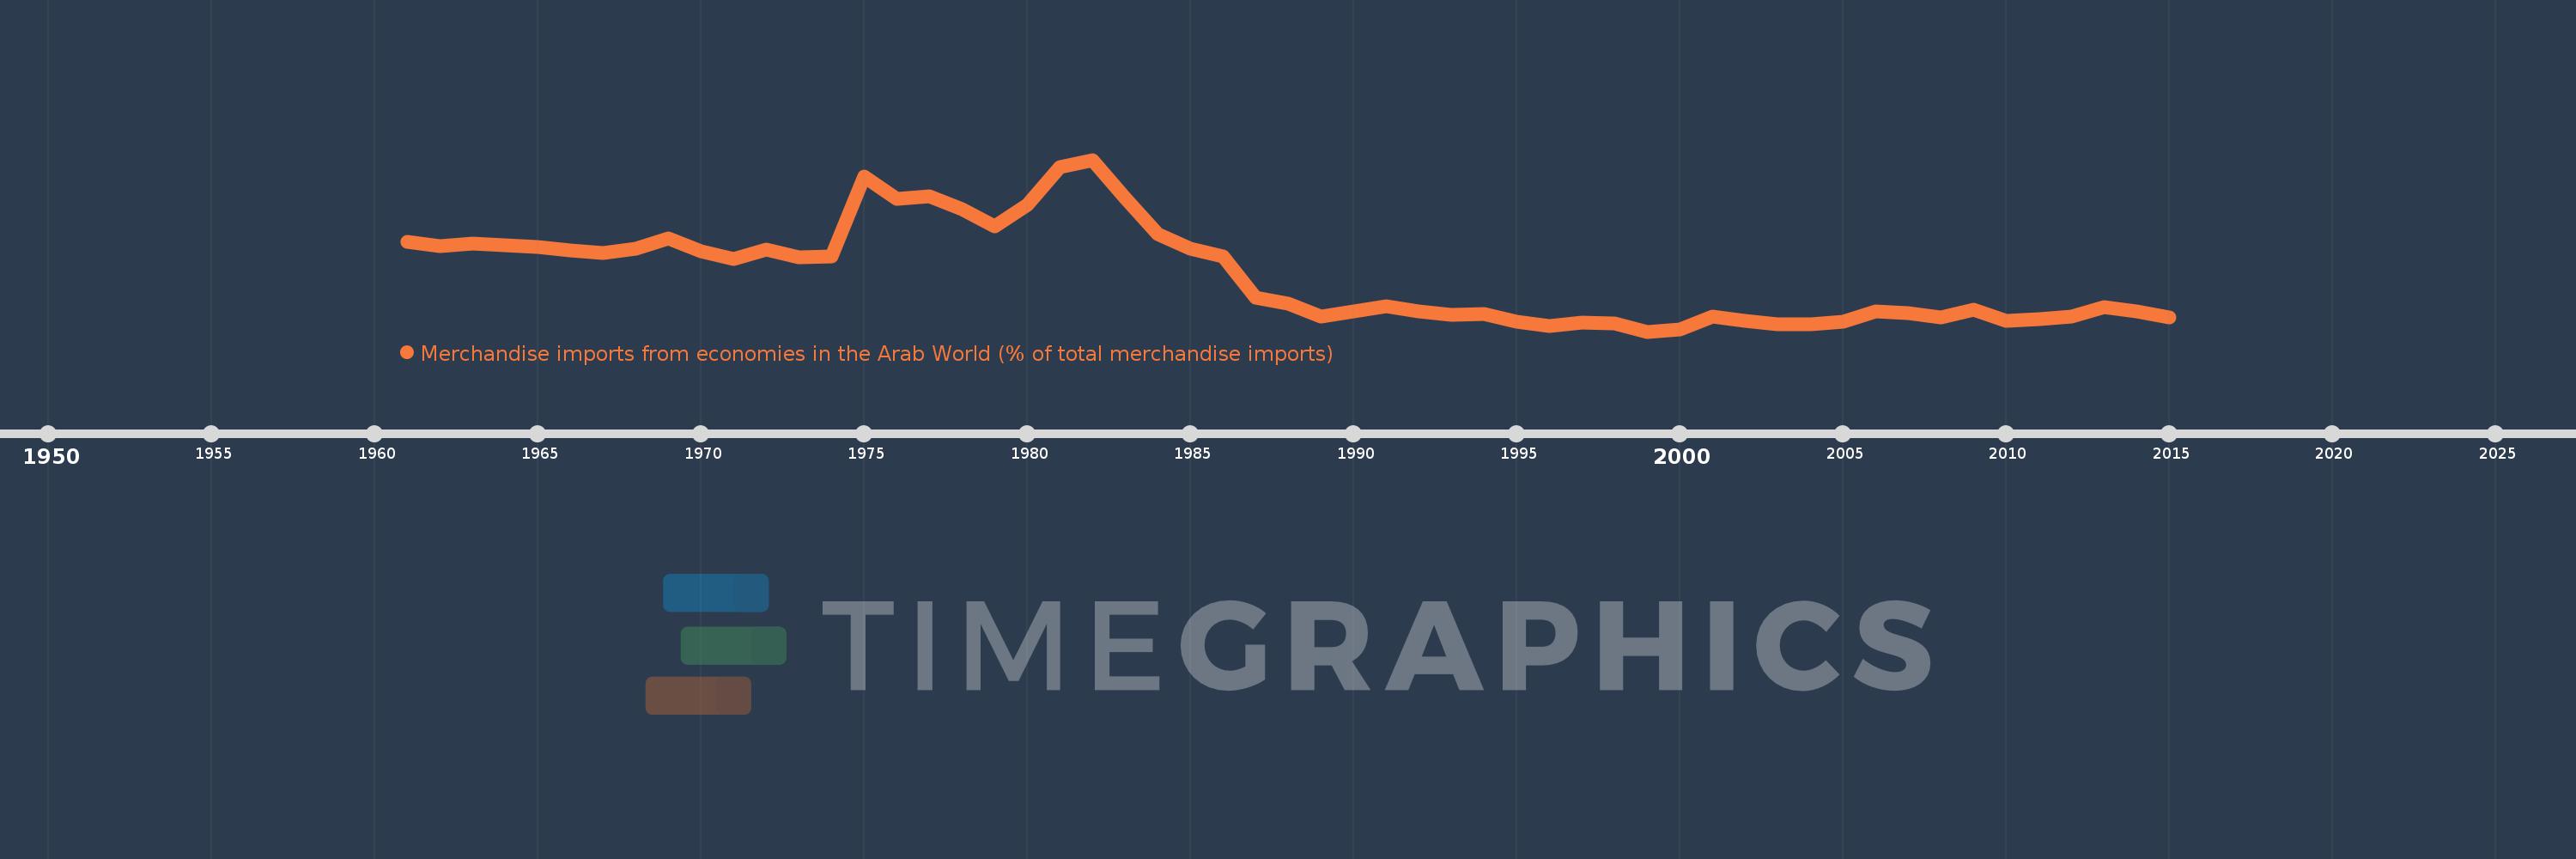
Merchandise imports from economies in the Arab World (% of total merchandise imports)
2015,2014,2013,2012,2011,2010,2009,2008,2007,2006,2005,2004,2003,2002,2001,2000,1999,1998,1997,1996,1995,1994,1993,1992,1991,1990,1989,1988,1987,1986,1985,1984,1983,1982,1981,1980,1979,1978,1977,1976,1975,1974,1973,1972,1971,1970,1969,1968,1967,1966,1965,1964,1963,1962,1961
This statistics in other country:
AfghanistanAlbaniaAlgeriaAngolaArab WorldArgentinaArmeniaArubaAustraliaAustriaAzerbaijanBahamas, TheBahrainBangladeshBarbadosBelarusBelgiumBelizeBeninBermudaBoliviaBrazilBrunei DarussalamBulgariaBurkina FasoBurundiCabo VerdeCambodiaCameroonCanadaCaribbean small statesCentral African RepublicCentral Europe and the BalticsChadChileChinaColombiaComorosCongo, Dem. Rep.Congo, Rep.Costa RicaCote d'IvoireCroatiaCubaCyprusCzech RepublicDenmarkDjiboutiDominicaDominican RepublicEarly-demographic dividendEast Asia & PacificEast Asia & Pacific (excluding high income)East Asia & Pacific (IDA & IBRD countries)EcuadorEgypt, Arab Rep.El SalvadorEstoniaEthiopiaEuro areaEurope & Central AsiaEurope & Central Asia (excluding high income)Europe & Central Asia (IDA & IBRD countries)European UnionFijiFinlandFragile and conflict affected situationsFranceFrench PolynesiaGabonGambia, TheGeorgiaGermanyGhanaGreeceGreenlandGrenadaGuatemalaGuineaGuinea-BissauGuyanaHaitiHeavily indebted poor countries (HIPC)High incomeHondurasHong Kong SAR, ChinaHungaryIBRD onlyIcelandIDA & IBRD totalIDA blendIDA onlyIDA totalIndiaIndonesiaIran, Islamic Rep.IraqIrelandItalyJamaicaJapanJordanKazakhstanKenyaKorea, Dem. People’s Rep.Korea, Rep.KuwaitKyrgyz RepublicLao PDRLate-demographic dividendLatin America & Caribbean Latin America & Caribbean (excluding high income)Latin America & the Caribbean (IDA & IBRD countries)LatviaLeast developed countries: UN classificationLebanonLiberiaLibyaLithuaniaLow & middle incomeLow incomeLower middle incomeLuxembourgMacao SAR, ChinaMacedonia, FYRMadagascarMalawiMalaysiaMaldivesMaliMaltaMauritaniaMauritiusMexicoMiddle East & North AfricaMiddle East & North Africa (excluding high income)Middle East & North Africa (IDA & IBRD countries)Middle incomeMoldovaMongoliaMontenegroMoroccoMozambiqueMyanmarNepalNetherlandsNew CaledoniaNew ZealandNicaraguaNigerNigeriaNorth AmericaNorwayOECD membersOmanOther small statesPacific island small statesPakistanPanamaPapua New GuineaParaguayPeruPhilippinesPolandPortugalPost-demographic dividendPre-demographic dividendQatarRomaniaRussian FederationRwandaSaudi ArabiaSenegalSerbiaSeychellesSierra LeoneSingaporeSlovak RepublicSloveniaSmall statesSomaliaSouth AfricaSouth AsiaSouth Asia (IDA & IBRD)SpainSri LankaSt. LuciaSt. Vincent and the GrenadinesSub-Saharan Africa Sub-Saharan Africa (excluding high income)Sub-Saharan Africa (IDA & IBRD countries)SudanSurinameSwedenSwitzerlandSyrian Arab RepublicTajikistanTanzaniaThailandTogoTrinidad and TobagoTunisiaTurkeyTurkmenistanUgandaUkraineUnited Arab EmiratesUnited KingdomUnited StatesUpper middle incomeUruguayVenezuela, RBVietnamWorldYemen, Rep.ZambiaZimbabwe Timeline:
This timeline shows a graph from 1961 to 2015 of European Union. No data until 1960. Number of actual observations by date: 55.
Source name:
World Development Indicators
Source organization:
World Bank staff estimates based data from International Monetary Fund's Direction of Trade database.
Categories, topics:
Private Sector, Trade
Last updated:
apr 23, 2017
Indicators value changes by year
Maximum:
12.127
jan 1, 1982
At the date of observation
Value
Absolute change
Change from previous value
jan 1, 1961
7.318
+7.318
0.0%
jan 1, 1962
7.068
-0.25
-3.41%
jan 1, 1963
7.194
+0.126
1.79%
jan 1, 1964
7.102
-0.092
-1.28%
jan 1, 1965
6.994
-0.108
-1.52%
jan 1, 1966
6.787
-0.207
-2.96%
jan 1, 1967
6.673
-0.114
-1.68%
jan 1, 1968
6.887
+0.214
3.21%
jan 1, 1969
7.523
+0.636
9.24%
jan 1, 1970
6.783
-0.74
-9.83%
jan 1, 1971
6.292
-0.491
-7.24%
jan 1, 1972
6.88
+0.588
9.35%
jan 1, 1973
6.39
-0.491
-7.13%
jan 1, 1974
6.456
+0.066
1.04%
jan 1, 1975
11.132
+4.676
72.43%
jan 1, 1976
9.832
-1.3
-11.68%
jan 1, 1977
9.974
+0.142
1.45%
jan 1, 1978
9.23
-0.744
-7.46%
jan 1, 1979
8.212
-1.018
-11.03%
jan 1, 1980
9.483
+1.271
15.48%
jan 1, 1981
11.721
+2.238
23.6%
jan 1, 1982
12.127
+0.406
3.46%
jan 1, 1983
9.905
-2.222
-18.33%
jan 1, 1984
7.778
-2.126
-21.47%
jan 1, 1985
6.889
-0.889
-11.43%
jan 1, 1986
6.467
-0.422
-6.12%
jan 1, 1987
4.022
-2.445
-37.81%
jan 1, 1988
3.707
-0.316
-7.85%
jan 1, 1989
2.938
-0.769
-20.73%
jan 1, 1990
3.252
+0.314
10.7%
jan 1, 1991
3.528
+0.276
8.48%
jan 1, 1992
3.238
-0.291
-8.24%
jan 1, 1993
3.018
-0.22
-6.79%
jan 1, 1994
3.059
+0.041
1.35%
jan 1, 1995
2.638
-0.421
-13.78%
jan 1, 1996
2.395
-0.243
-9.21%
jan 1, 1997
2.564
+0.169
7.06%
jan 1, 1998
2.516
-0.048
-1.87%
jan 1, 1999
2.046
-0.47
-18.69%
jan 1, 2000
2.172
+0.126
6.16%
jan 1, 2001
2.929
+0.758
34.89%
jan 1, 2002
2.677
-0.252
-8.6%
jan 1, 2003
2.484
-0.194
-7.24%
jan 1, 2004
2.47
-0.014
-0.55%
jan 1, 2005
2.603
+0.133
5.39%
jan 1, 2006
3.211
+0.608
23.35%
jan 1, 2007
3.133
-0.079
-2.45%
jan 1, 2008
2.867
-0.266
-8.49%
jan 1, 2009
3.35
+0.483
16.85%
jan 1, 2010
2.697
-0.652
-19.47%
jan 1, 2011
2.78
+0.083
3.08%
jan 1, 2012
2.925
+0.144
5.19%
jan 1, 2013
3.46
+0.535
18.29%
jan 1, 2014
3.243
-0.216
-6.25%
jan 1, 2015
2.878
-0.365
-11.25%
Ranking of countries by current statistics by years


Comments: