29
/
en
AIzaSyAYiBZKx7MnpbEhh9jyipgxe19OcubqV5w
April 1, 2024
236055
Senegal
SEN
true
2
1
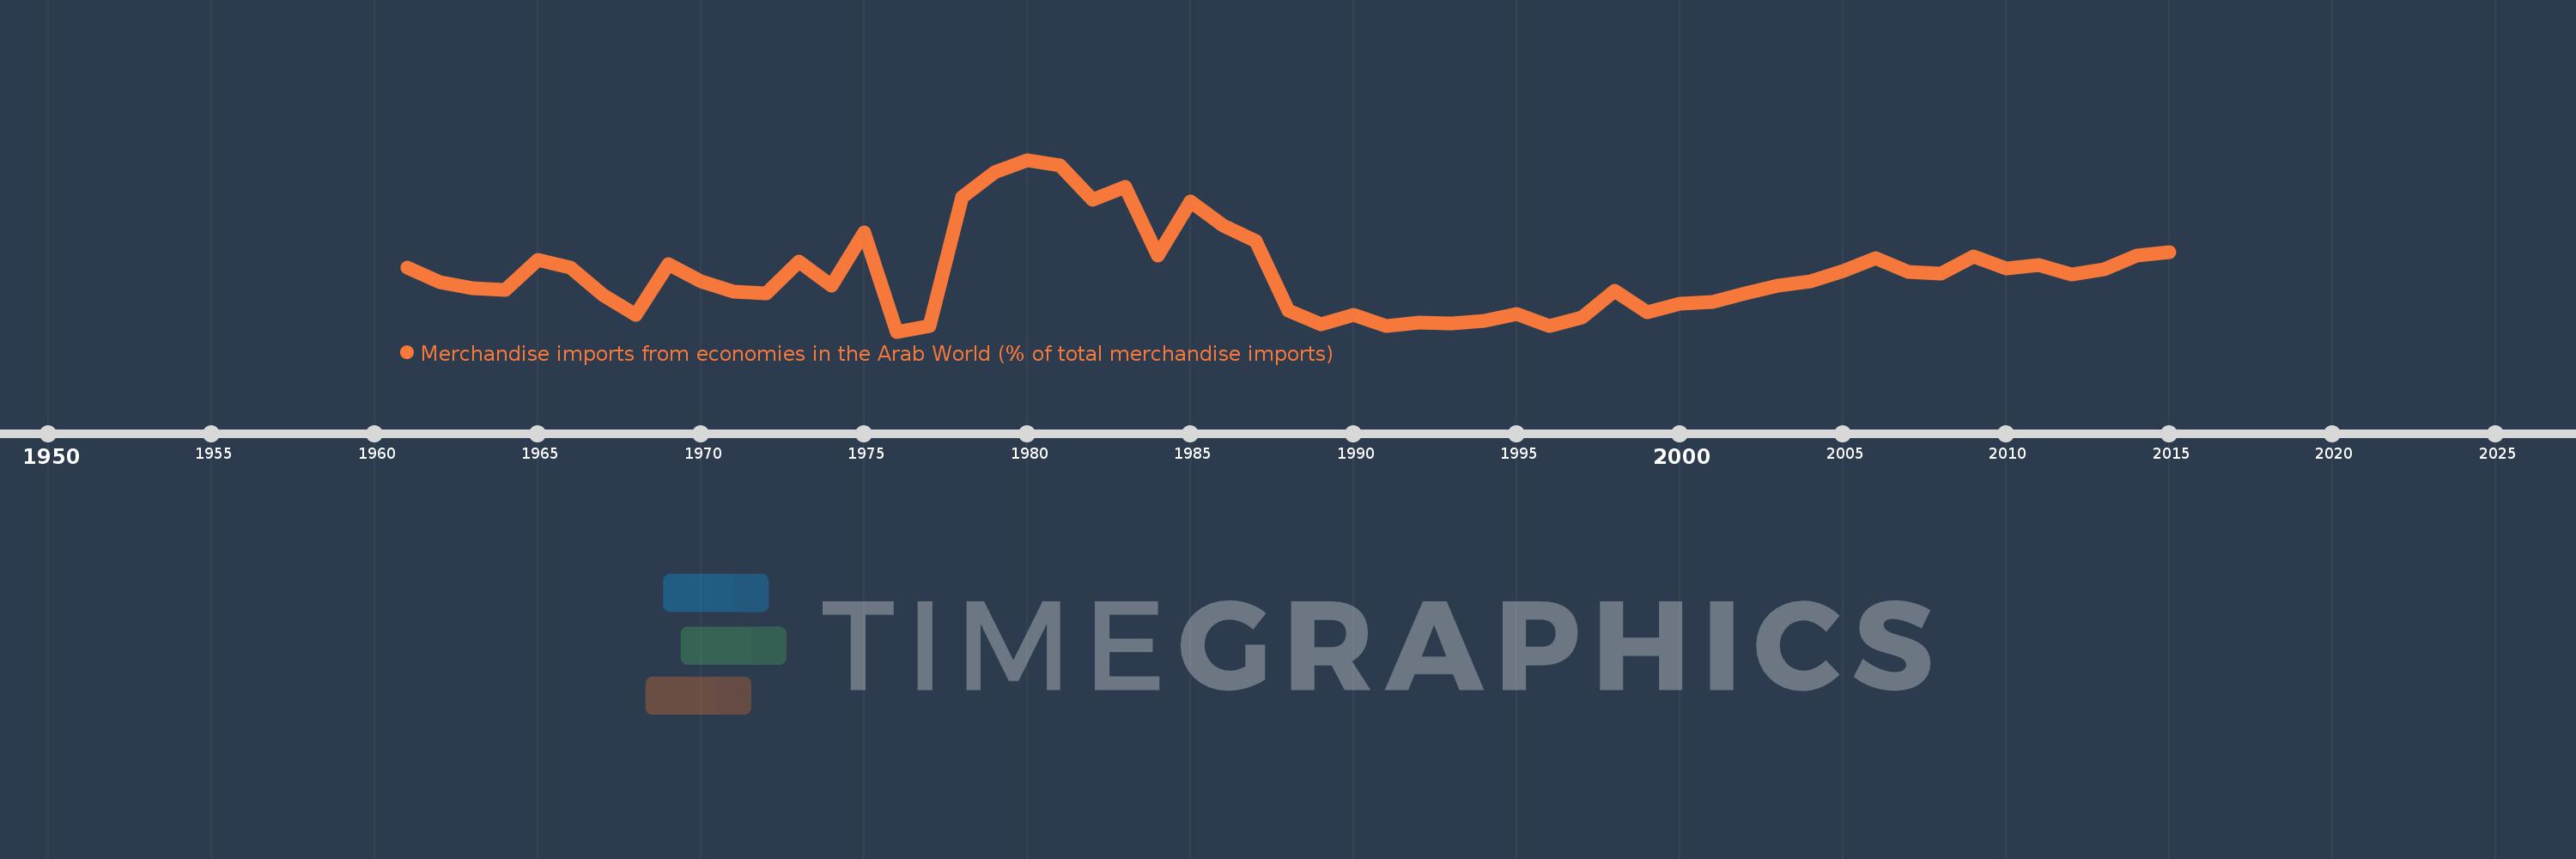
Merchandise imports from economies in the Arab World (% of total merchandise imports)
2015,2014,2013,2012,2011,2010,2009,2008,2007,2006,2005,2004,2003,2002,2001,2000,1999,1998,1997,1996,1995,1994,1993,1992,1991,1990,1989,1988,1987,1986,1985,1984,1983,1982,1981,1980,1979,1978,1977,1976,1975,1974,1973,1972,1971,1970,1969,1968,1967,1966,1965,1964,1963,1962,1961
This statistics in other country:
AfghanistanAlbaniaAlgeriaAngolaArab WorldArgentinaArmeniaArubaAustraliaAustriaAzerbaijanBahamas, TheBahrainBangladeshBarbadosBelarusBelgiumBelizeBeninBermudaBoliviaBrazilBrunei DarussalamBulgariaBurkina FasoBurundiCabo VerdeCambodiaCameroonCanadaCaribbean small statesCentral African RepublicCentral Europe and the BalticsChadChileChinaColombiaComorosCongo, Dem. Rep.Congo, Rep.Costa RicaCote d'IvoireCroatiaCubaCyprusCzech RepublicDenmarkDjiboutiDominicaDominican RepublicEarly-demographic dividendEast Asia & PacificEast Asia & Pacific (excluding high income)East Asia & Pacific (IDA & IBRD countries)EcuadorEgypt, Arab Rep.El SalvadorEstoniaEthiopiaEuro areaEurope & Central AsiaEurope & Central Asia (excluding high income)Europe & Central Asia (IDA & IBRD countries)European UnionFijiFinlandFragile and conflict affected situationsFranceFrench PolynesiaGabonGambia, TheGeorgiaGermanyGhanaGreeceGreenlandGrenadaGuatemalaGuineaGuinea-BissauGuyanaHaitiHeavily indebted poor countries (HIPC)High incomeHondurasHong Kong SAR, ChinaHungaryIBRD onlyIcelandIDA & IBRD totalIDA blendIDA onlyIDA totalIndiaIndonesiaIran, Islamic Rep.IraqIrelandItalyJamaicaJapanJordanKazakhstanKenyaKorea, Dem. People’s Rep.Korea, Rep.KuwaitKyrgyz RepublicLao PDRLate-demographic dividendLatin America & Caribbean Latin America & Caribbean (excluding high income)Latin America & the Caribbean (IDA & IBRD countries)LatviaLeast developed countries: UN classificationLebanonLiberiaLibyaLithuaniaLow & middle incomeLow incomeLower middle incomeLuxembourgMacao SAR, ChinaMacedonia, FYRMadagascarMalawiMalaysiaMaldivesMaliMaltaMauritaniaMauritiusMexicoMiddle East & North AfricaMiddle East & North Africa (excluding high income)Middle East & North Africa (IDA & IBRD countries)Middle incomeMoldovaMongoliaMontenegroMoroccoMozambiqueMyanmarNepalNetherlandsNew CaledoniaNew ZealandNicaraguaNigerNigeriaNorth AmericaNorwayOECD membersOmanOther small statesPacific island small statesPakistanPanamaPapua New GuineaParaguayPeruPhilippinesPolandPortugalPost-demographic dividendPre-demographic dividendQatarRomaniaRussian FederationRwandaSaudi ArabiaSenegalSerbiaSeychellesSierra LeoneSingaporeSlovak RepublicSloveniaSmall statesSomaliaSouth AfricaSouth AsiaSouth Asia (IDA & IBRD)SpainSri LankaSt. LuciaSt. Vincent and the GrenadinesSub-Saharan Africa Sub-Saharan Africa (excluding high income)Sub-Saharan Africa (IDA & IBRD countries)SudanSurinameSwedenSwitzerlandSyrian Arab RepublicTajikistanTanzaniaThailandTogoTrinidad and TobagoTunisiaTurkeyTurkmenistanUgandaUkraineUnited Arab EmiratesUnited KingdomUnited StatesUpper middle incomeUruguayVenezuela, RBVietnamWorldYemen, Rep.ZambiaZimbabwe Timeline:
This timeline shows a graph from 1961 to 2015 of Senegal. No data until 1960. Number of actual observations by date: 55.
Source name:
World Development Indicators
Source organization:
World Bank staff estimates based data from International Monetary Fund's Direction of Trade database.
Categories, topics:
Private Sector, Trade
Last updated:
apr 23, 2017
Indicators value changes by year
Maximum:
10.949
jan 1, 1980
At the date of observation
Value
Absolute change
Change from previous value
jan 1, 1961
4.35
+4.35
0.0%
jan 1, 1962
3.468
-0.883
-20.29%
jan 1, 1963
3.109
-0.359
-10.35%
jan 1, 1964
2.967
-0.141
-4.55%
jan 1, 1965
4.851
+1.884
63.48%
jan 1, 1966
4.335
-0.516
-10.65%
jan 1, 1967
2.645
-1.689
-38.98%
jan 1, 1968
1.473
-1.172
-44.32%
jan 1, 1969
4.573
+3.1
210.5%
jan 1, 1970
3.513
-1.061
-23.19%
jan 1, 1971
2.886
-0.627
-17.84%
jan 1, 1972
2.788
-0.098
-3.4%
jan 1, 1973
4.699
+1.911
68.56%
jan 1, 1974
3.268
-1.432
-30.47%
jan 1, 1975
6.492
+3.224
98.68%
jan 1, 1976
0.436
-6.056
-93.29%
jan 1, 1977
0.789
+0.353
81.1%
jan 1, 1978
8.647
+7.858
996.01%
jan 1, 1979
10.171
+1.524
17.62%
jan 1, 1980
10.949
+0.779
7.65%
jan 1, 1981
10.591
-0.359
-3.27%
jan 1, 1982
8.524
-2.067
-19.52%
jan 1, 1983
9.318
+0.794
9.31%
jan 1, 1984
5.087
-4.231
-45.41%
jan 1, 1985
8.382
+3.296
64.79%
jan 1, 1986
6.92
-1.462
-17.44%
jan 1, 1987
5.999
-0.922
-13.32%
jan 1, 1988
1.717
-4.282
-71.38%
jan 1, 1989
0.873
-0.843
-49.12%
jan 1, 1990
1.454
+0.581
66.51%
jan 1, 1991
0.77
-0.684
-47.04%
jan 1, 1992
0.972
+0.202
26.16%
jan 1, 1993
0.954
-0.018
-1.84%
jan 1, 1994
1.1
+0.146
15.29%
jan 1, 1995
1.498
+0.398
36.22%
jan 1, 1996
0.783
-0.715
-47.72%
jan 1, 1997
1.304
+0.521
66.53%
jan 1, 1998
2.914
+1.61
123.44%
jan 1, 1999
1.61
-1.305
-44.77%
jan 1, 2000
2.137
+0.527
32.76%
jan 1, 2001
2.267
+0.13
6.08%
jan 1, 2002
2.774
+0.507
22.35%
jan 1, 2003
3.261
+0.488
17.59%
jan 1, 2004
3.494
+0.232
7.12%
jan 1, 2005
4.146
+0.652
18.66%
jan 1, 2006
4.949
+0.804
19.39%
jan 1, 2007
4.113
-0.836
-16.9%
jan 1, 2008
3.963
-0.15
-3.64%
jan 1, 2009
5.019
+1.056
26.64%
jan 1, 2010
4.312
-0.707
-14.09%
jan 1, 2011
4.511
+0.199
4.62%
jan 1, 2012
3.951
-0.56
-12.42%
jan 1, 2013
4.266
+0.315
7.98%
jan 1, 2014
5.112
+0.846
19.83%
jan 1, 2015
5.289
+0.176
3.45%
Ranking of countries by current statistics by years


Comments: