29
/
en
AIzaSyAYiBZKx7MnpbEhh9jyipgxe19OcubqV5w
April 1, 2024
148212
Guyana
GUY
true
2
1
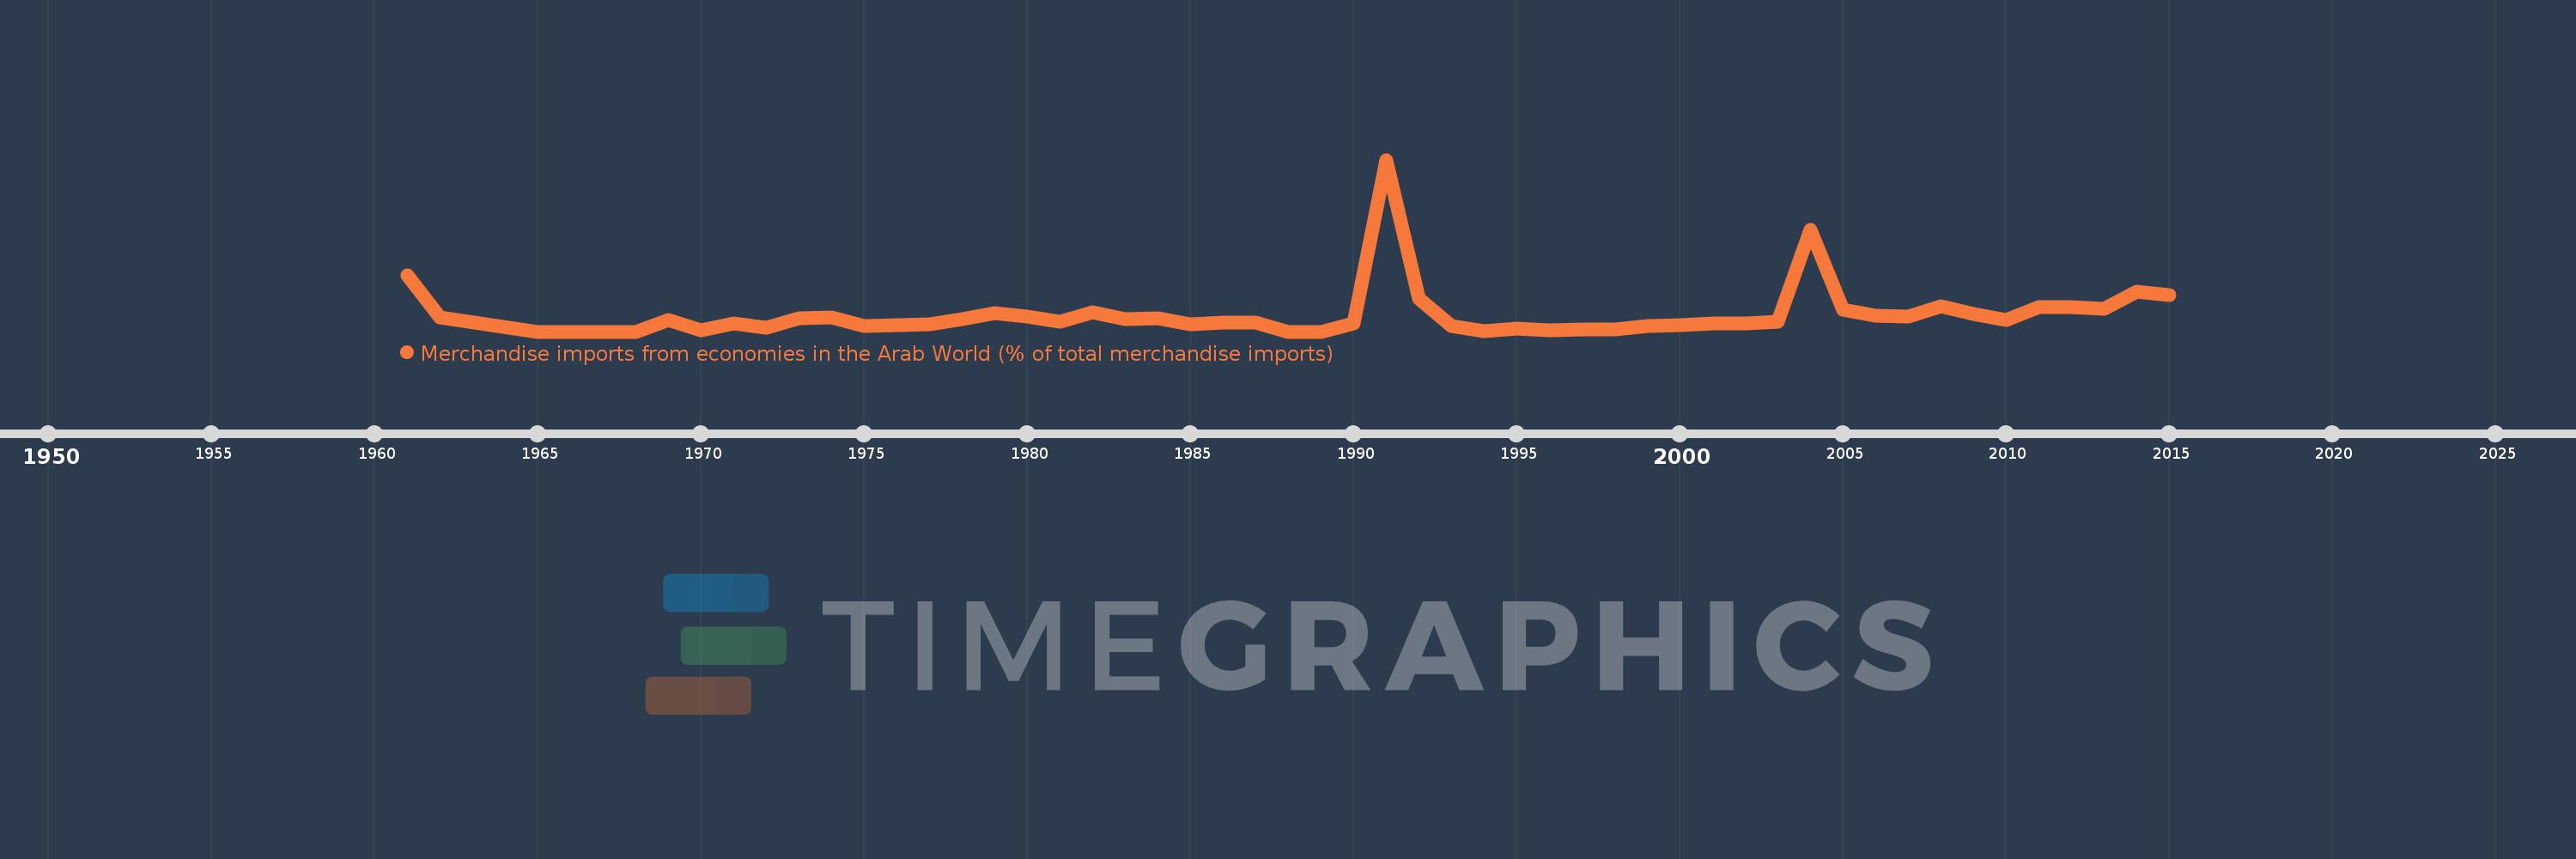
Merchandise imports from economies in the Arab World (% of total merchandise imports)
2015,2014,2013,2012,2011,2010,2009,2008,2007,2006,2005,2004,2003,2002,2001,2000,1999,1998,1997,1996,1995,1994,1993,1992,1991,1990,1989,1988,1987,1986,1985,1984,1983,1982,1981,1980,1979,1978,1977,1976,1975,1974,1973,1972,1971,1970,1969,1968,1967,1966,1965,1962,1961
This statistics in other country:
AfghanistanAlbaniaAlgeriaAngolaArab WorldArgentinaArmeniaArubaAustraliaAustriaAzerbaijanBahamas, TheBahrainBangladeshBarbadosBelarusBelgiumBelizeBeninBermudaBoliviaBrazilBrunei DarussalamBulgariaBurkina FasoBurundiCabo VerdeCambodiaCameroonCanadaCaribbean small statesCentral African RepublicCentral Europe and the BalticsChadChileChinaColombiaComorosCongo, Dem. Rep.Congo, Rep.Costa RicaCote d'IvoireCroatiaCubaCyprusCzech RepublicDenmarkDjiboutiDominicaDominican RepublicEarly-demographic dividendEast Asia & PacificEast Asia & Pacific (excluding high income)East Asia & Pacific (IDA & IBRD countries)EcuadorEgypt, Arab Rep.El SalvadorEstoniaEthiopiaEuro areaEurope & Central AsiaEurope & Central Asia (excluding high income)Europe & Central Asia (IDA & IBRD countries)European UnionFijiFinlandFragile and conflict affected situationsFranceFrench PolynesiaGabonGambia, TheGeorgiaGermanyGhanaGreeceGreenlandGrenadaGuatemalaGuineaGuinea-BissauGuyanaHaitiHeavily indebted poor countries (HIPC)High incomeHondurasHong Kong SAR, ChinaHungaryIBRD onlyIcelandIDA & IBRD totalIDA blendIDA onlyIDA totalIndiaIndonesiaIran, Islamic Rep.IraqIrelandItalyJamaicaJapanJordanKazakhstanKenyaKorea, Dem. People’s Rep.Korea, Rep.KuwaitKyrgyz RepublicLao PDRLate-demographic dividendLatin America & Caribbean Latin America & Caribbean (excluding high income)Latin America & the Caribbean (IDA & IBRD countries)LatviaLeast developed countries: UN classificationLebanonLiberiaLibyaLithuaniaLow & middle incomeLow incomeLower middle incomeLuxembourgMacao SAR, ChinaMacedonia, FYRMadagascarMalawiMalaysiaMaldivesMaliMaltaMauritaniaMauritiusMexicoMiddle East & North AfricaMiddle East & North Africa (excluding high income)Middle East & North Africa (IDA & IBRD countries)Middle incomeMoldovaMongoliaMontenegroMoroccoMozambiqueMyanmarNepalNetherlandsNew CaledoniaNew ZealandNicaraguaNigerNigeriaNorth AmericaNorwayOECD membersOmanOther small statesPacific island small statesPakistanPanamaPapua New GuineaParaguayPeruPhilippinesPolandPortugalPost-demographic dividendPre-demographic dividendQatarRomaniaRussian FederationRwandaSaudi ArabiaSenegalSerbiaSeychellesSierra LeoneSingaporeSlovak RepublicSloveniaSmall statesSomaliaSouth AfricaSouth AsiaSouth Asia (IDA & IBRD)SpainSri LankaSt. LuciaSt. Vincent and the GrenadinesSub-Saharan Africa Sub-Saharan Africa (excluding high income)Sub-Saharan Africa (IDA & IBRD countries)SudanSurinameSwedenSwitzerlandSyrian Arab RepublicTajikistanTanzaniaThailandTogoTrinidad and TobagoTunisiaTurkeyTurkmenistanUgandaUkraineUnited Arab EmiratesUnited KingdomUnited StatesUpper middle incomeUruguayVenezuela, RBVietnamWorldYemen, Rep.ZambiaZimbabwe Timeline:
This timeline shows a graph from 1961 to 2015 of Guyana. No data until 1960. Number of actual observations by date: 53.
Source name:
World Development Indicators
Source organization:
World Bank staff estimates based data from International Monetary Fund's Direction of Trade database.
Categories, topics:
Private Sector, Trade
Last updated:
apr 23, 2017
Indicators value changes by year
At the date of observation
Value
Absolute change
Change from previous value
jan 1, 1961
0.465
+0.465
0.0%
jan 1, 1962
0.117
-0.347
-74.8%
jan 1, 1965
0.0
-0.117
-100.0%
jan 1, 1969
0.094
+0.094
%
jan 1, 1970
0.013
-0.082
-86.53%
jan 1, 1971
0.069
+0.057
446.23%
jan 1, 1972
0.032
-0.037
-53.74%
jan 1, 1973
0.107
+0.075
233.08%
jan 1, 1974
0.12
+0.013
12.36%
jan 1, 1975
0.044
-0.076
-63.16%
jan 1, 1976
0.05
+0.006
13.59%
jan 1, 1977
0.061
+0.011
22.05%
jan 1, 1978
0.102
+0.041
66.71%
jan 1, 1979
0.152
+0.049
48.21%
jan 1, 1980
0.126
-0.025
-16.79%
jan 1, 1981
0.079
-0.047
-37.0%
jan 1, 1982
0.161
+0.081
102.49%
jan 1, 1983
0.106
-0.055
-34.08%
jan 1, 1984
0.113
+0.007
6.42%
jan 1, 1985
0.058
-0.055
-48.57%
jan 1, 1986
0.076
+0.018
30.73%
jan 1, 1987
0.076
+0.0
0.0%
jan 1, 1988
0.0
-0.075
-99.35%
jan 1, 1989
0.0
0.0
-19.09%
jan 1, 1990
0.064
+0.063
15.76K%
jan 1, 1991
1.417
+1.353
2.13K%
jan 1, 1992
0.27
-1.147
-80.93%
jan 1, 1993
0.049
-0.222
-82.05%
jan 1, 1994
0.006
-0.043
-87.69%
jan 1, 1995
0.027
+0.021
344.39%
jan 1, 1996
0.009
-0.017
-64.47%
jan 1, 1997
0.017
+0.008
79.81%
jan 1, 1998
0.015
-0.001
-8.68%
jan 1, 1999
0.045
+0.029
188.58%
jan 1, 2000
0.05
+0.005
12.01%
jan 1, 2001
0.069
+0.019
38.38%
jan 1, 2002
0.07
+0.001
1.54%
jan 1, 2003
0.083
+0.013
17.86%
jan 1, 2004
0.838
+0.755
910.92%
jan 1, 2005
0.179
-0.66
-78.69%
jan 1, 2006
0.128
-0.05
-28.23%
jan 1, 2007
0.127
-0.001
-1.0%
jan 1, 2008
0.209
+0.082
64.93%
jan 1, 2009
0.144
-0.066
-31.41%
jan 1, 2010
0.094
-0.049
-34.28%
jan 1, 2011
0.2
+0.105
111.8%
jan 1, 2012
0.204
+0.005
2.33%
jan 1, 2013
0.188
-0.016
-7.89%
jan 1, 2014
0.326
+0.138
73.04%
jan 1, 2015
0.301
-0.025
-7.7%
Ranking of countries by current statistics by years


Comments: