29
/
en
AIzaSyAYiBZKx7MnpbEhh9jyipgxe19OcubqV5w
April 1, 2024
28340
East Asia & Pacific (excluding high income)
EAP
false
2
1
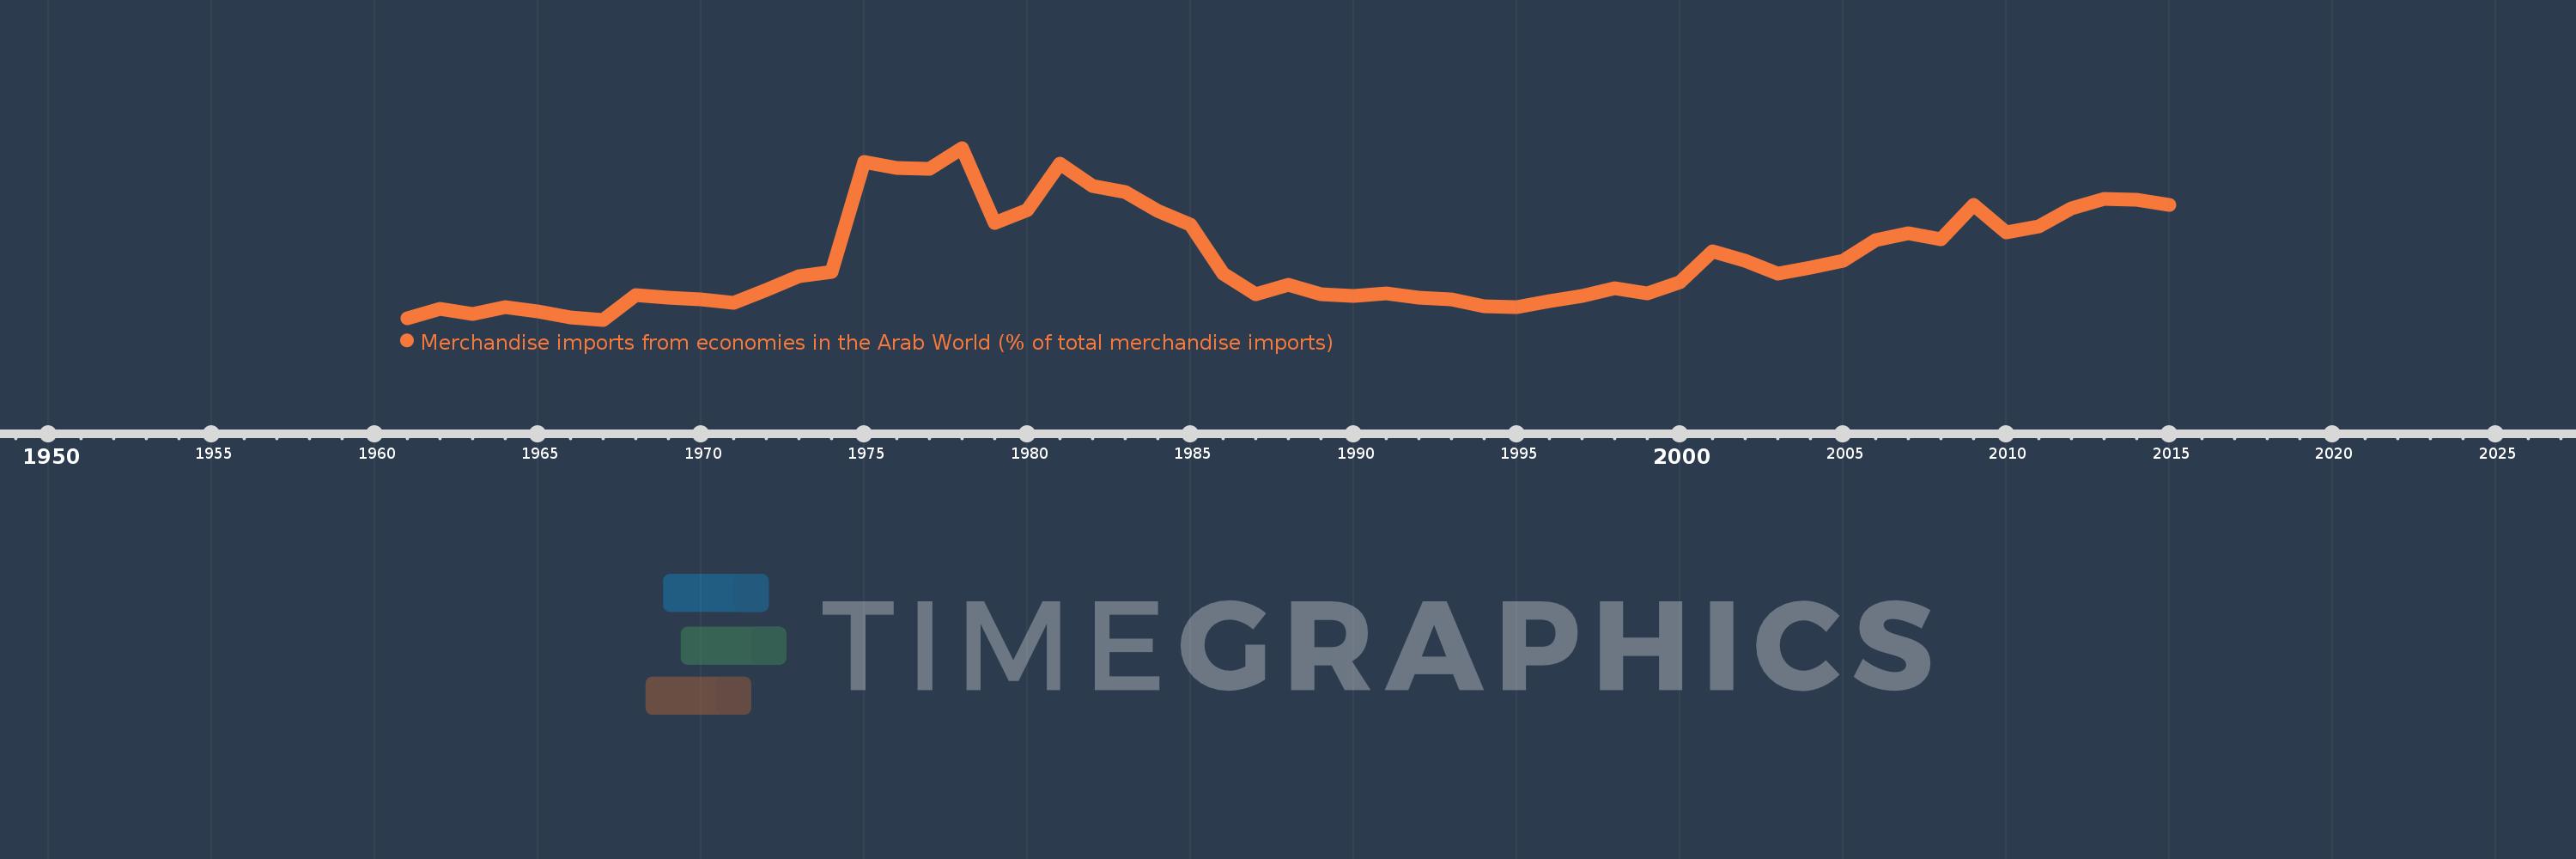
Merchandise imports from economies in the Arab World (% of total merchandise imports)
2015,2014,2013,2012,2011,2010,2009,2008,2007,2006,2005,2004,2003,2002,2001,2000,1999,1998,1997,1996,1995,1994,1993,1992,1991,1990,1989,1988,1987,1986,1985,1984,1983,1982,1981,1980,1979,1978,1977,1976,1975,1974,1973,1972,1971,1970,1969,1968,1967,1966,1965,1964,1963,1962,1961
This statistics in other country:
AfghanistanAlbaniaAlgeriaAngolaArab WorldArgentinaArmeniaArubaAustraliaAustriaAzerbaijanBahamas, TheBahrainBangladeshBarbadosBelarusBelgiumBelizeBeninBermudaBoliviaBrazilBrunei DarussalamBulgariaBurkina FasoBurundiCabo VerdeCambodiaCameroonCanadaCaribbean small statesCentral African RepublicCentral Europe and the BalticsChadChileChinaColombiaComorosCongo, Dem. Rep.Congo, Rep.Costa RicaCote d'IvoireCroatiaCubaCyprusCzech RepublicDenmarkDjiboutiDominicaDominican RepublicEarly-demographic dividendEast Asia & PacificEast Asia & Pacific (excluding high income)East Asia & Pacific (IDA & IBRD countries)EcuadorEgypt, Arab Rep.El SalvadorEstoniaEthiopiaEuro areaEurope & Central AsiaEurope & Central Asia (excluding high income)Europe & Central Asia (IDA & IBRD countries)European UnionFijiFinlandFragile and conflict affected situationsFranceFrench PolynesiaGabonGambia, TheGeorgiaGermanyGhanaGreeceGreenlandGrenadaGuatemalaGuineaGuinea-BissauGuyanaHaitiHeavily indebted poor countries (HIPC)High incomeHondurasHong Kong SAR, ChinaHungaryIBRD onlyIcelandIDA & IBRD totalIDA blendIDA onlyIDA totalIndiaIndonesiaIran, Islamic Rep.IraqIrelandItalyJamaicaJapanJordanKazakhstanKenyaKorea, Dem. People’s Rep.Korea, Rep.KuwaitKyrgyz RepublicLao PDRLate-demographic dividendLatin America & Caribbean Latin America & Caribbean (excluding high income)Latin America & the Caribbean (IDA & IBRD countries)LatviaLeast developed countries: UN classificationLebanonLiberiaLibyaLithuaniaLow & middle incomeLow incomeLower middle incomeLuxembourgMacao SAR, ChinaMacedonia, FYRMadagascarMalawiMalaysiaMaldivesMaliMaltaMauritaniaMauritiusMexicoMiddle East & North AfricaMiddle East & North Africa (excluding high income)Middle East & North Africa (IDA & IBRD countries)Middle incomeMoldovaMongoliaMontenegroMoroccoMozambiqueMyanmarNepalNetherlandsNew CaledoniaNew ZealandNicaraguaNigerNigeriaNorth AmericaNorwayOECD membersOmanOther small statesPacific island small statesPakistanPanamaPapua New GuineaParaguayPeruPhilippinesPolandPortugalPost-demographic dividendPre-demographic dividendQatarRomaniaRussian FederationRwandaSaudi ArabiaSenegalSerbiaSeychellesSierra LeoneSingaporeSlovak RepublicSloveniaSmall statesSomaliaSouth AfricaSouth AsiaSouth Asia (IDA & IBRD)SpainSri LankaSt. LuciaSt. Vincent and the GrenadinesSub-Saharan Africa Sub-Saharan Africa (excluding high income)Sub-Saharan Africa (IDA & IBRD countries)SudanSurinameSwedenSwitzerlandSyrian Arab RepublicTajikistanTanzaniaThailandTogoTrinidad and TobagoTunisiaTurkeyTurkmenistanUgandaUkraineUnited Arab EmiratesUnited KingdomUnited StatesUpper middle incomeUruguayVenezuela, RBVietnamWorldYemen, Rep.ZambiaZimbabwe Timeline:
This timeline shows a graph from 1961 to 2015 of East Asia & Pacific (excluding high income). No data until 1960. Number of actual observations by date: 55.
Source name:
World Development Indicators
Source organization:
World Bank staff estimates based data from International Monetary Fund's Direction of Trade database.
Categories, topics:
Private Sector, Trade
Last updated:
apr 23, 2017
Indicators value changes by year
At the date of observation
Value
Absolute change
Change from previous value
jan 1, 1961
1.356
+1.356
0.0%
jan 1, 1962
1.846
+0.49
36.17%
jan 1, 1963
1.583
-0.263
-14.24%
jan 1, 1964
1.928
+0.345
21.82%
jan 1, 1965
1.711
-0.218
-11.3%
jan 1, 1966
1.403
-0.308
-17.99%
jan 1, 1967
1.286
-0.117
-8.34%
jan 1, 1968
2.496
+1.21
94.13%
jan 1, 1969
2.387
-0.109
-4.35%
jan 1, 1970
2.307
-0.08
-3.37%
jan 1, 1971
2.109
-0.197
-8.56%
jan 1, 1972
2.745
+0.635
30.12%
jan 1, 1973
3.425
+0.68
24.77%
jan 1, 1974
3.651
+0.226
6.6%
jan 1, 1975
9.115
+5.464
149.66%
jan 1, 1976
8.833
-0.282
-3.09%
jan 1, 1977
8.754
-0.079
-0.89%
jan 1, 1978
9.807
+1.053
12.03%
jan 1, 1979
6.101
-3.706
-37.79%
jan 1, 1980
6.72
+0.62
10.16%
jan 1, 1981
9.036
+2.315
34.45%
jan 1, 1982
7.921
-1.115
-12.34%
jan 1, 1983
7.608
-0.313
-3.95%
jan 1, 1984
6.702
-0.906
-11.91%
jan 1, 1985
5.984
-0.717
-10.7%
jan 1, 1986
3.587
-2.397
-40.06%
jan 1, 1987
2.563
-1.024
-28.54%
jan 1, 1988
3.003
+0.439
17.14%
jan 1, 1989
2.548
-0.455
-15.15%
jan 1, 1990
2.462
-0.086
-3.37%
jan 1, 1991
2.59
+0.128
5.21%
jan 1, 1992
2.367
-0.223
-8.61%
jan 1, 1993
2.314
-0.053
-2.24%
jan 1, 1994
1.959
-0.355
-15.35%
jan 1, 1995
1.897
-0.062
-3.15%
jan 1, 1996
2.226
+0.329
17.33%
jan 1, 1997
2.474
+0.247
11.12%
jan 1, 1998
2.866
+0.392
15.86%
jan 1, 1999
2.599
-0.267
-9.3%
jan 1, 2000
3.128
+0.529
20.36%
jan 1, 2001
4.661
+1.533
49.0%
jan 1, 2002
4.22
-0.441
-9.47%
jan 1, 2003
3.594
-0.626
-14.84%
jan 1, 2004
3.89
+0.296
8.23%
jan 1, 2005
4.221
+0.331
8.52%
jan 1, 2006
5.224
+1.003
23.77%
jan 1, 2007
5.564
+0.34
6.51%
jan 1, 2008
5.291
-0.273
-4.91%
jan 1, 2009
6.997
+1.706
32.24%
jan 1, 2010
5.64
-1.356
-19.39%
jan 1, 2011
5.936
+0.296
5.25%
jan 1, 2012
6.832
+0.896
15.09%
jan 1, 2013
7.3
+0.468
6.85%
jan 1, 2014
7.225
-0.076
-1.03%
jan 1, 2015
6.998
-0.227
-3.14%
Ranking of countries by current statistics by years


Comments: