29
/
en
AIzaSyAYiBZKx7MnpbEhh9jyipgxe19OcubqV5w
April 1, 2024
213246
Nigeria
NGA
true
2
1
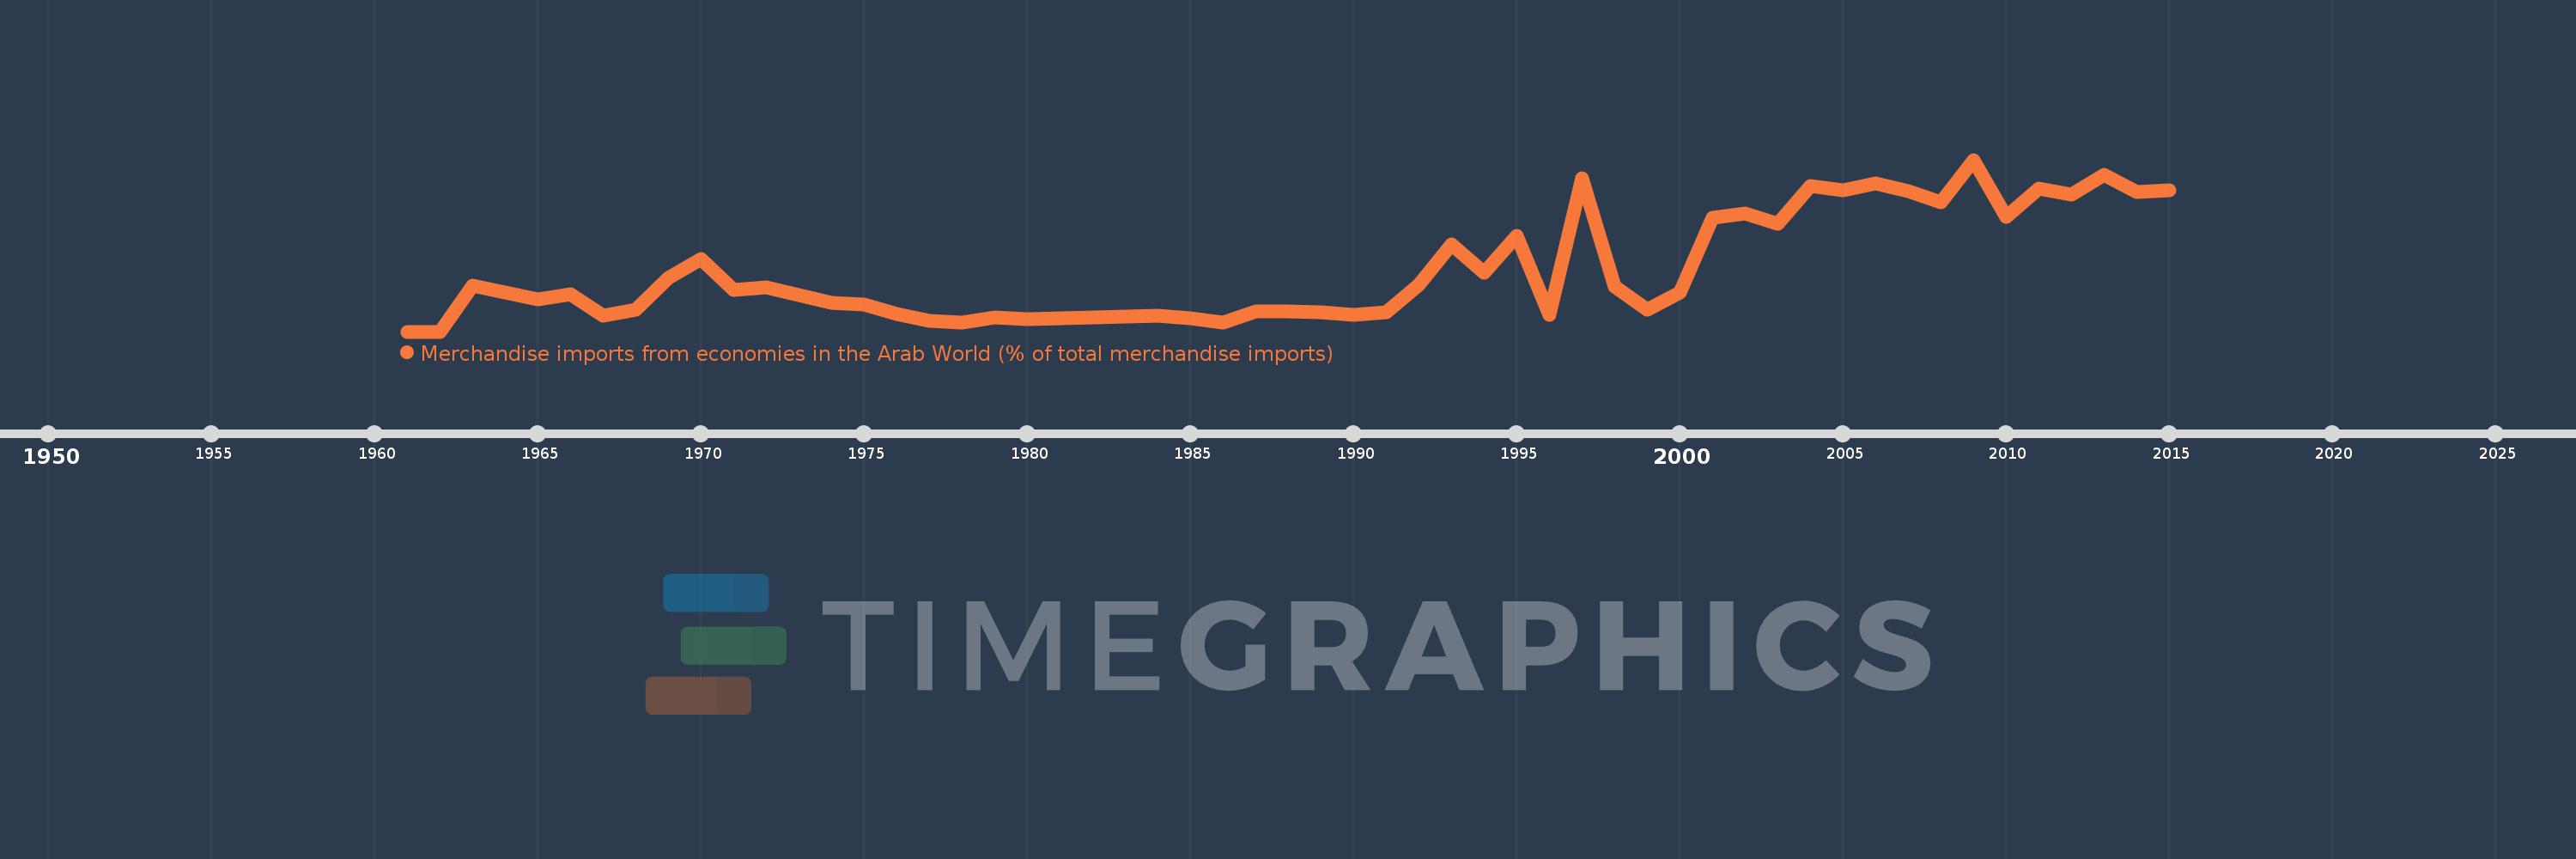
Merchandise imports from economies in the Arab World (% of total merchandise imports)
2015,2014,2013,2012,2011,2010,2009,2008,2007,2006,2005,2004,2003,2002,2001,2000,1999,1998,1997,1996,1995,1994,1993,1992,1991,1990,1989,1988,1987,1986,1985,1984,1983,1982,1980,1979,1978,1977,1976,1975,1974,1973,1972,1971,1970,1969,1968,1967,1966,1965,1964,1963,1962,1961
This statistics in other country:
AfghanistanAlbaniaAlgeriaAngolaArab WorldArgentinaArmeniaArubaAustraliaAustriaAzerbaijanBahamas, TheBahrainBangladeshBarbadosBelarusBelgiumBelizeBeninBermudaBoliviaBrazilBrunei DarussalamBulgariaBurkina FasoBurundiCabo VerdeCambodiaCameroonCanadaCaribbean small statesCentral African RepublicCentral Europe and the BalticsChadChileChinaColombiaComorosCongo, Dem. Rep.Congo, Rep.Costa RicaCote d'IvoireCroatiaCubaCyprusCzech RepublicDenmarkDjiboutiDominicaDominican RepublicEarly-demographic dividendEast Asia & PacificEast Asia & Pacific (excluding high income)East Asia & Pacific (IDA & IBRD countries)EcuadorEgypt, Arab Rep.El SalvadorEstoniaEthiopiaEuro areaEurope & Central AsiaEurope & Central Asia (excluding high income)Europe & Central Asia (IDA & IBRD countries)European UnionFijiFinlandFragile and conflict affected situationsFranceFrench PolynesiaGabonGambia, TheGeorgiaGermanyGhanaGreeceGreenlandGrenadaGuatemalaGuineaGuinea-BissauGuyanaHaitiHeavily indebted poor countries (HIPC)High incomeHondurasHong Kong SAR, ChinaHungaryIBRD onlyIcelandIDA & IBRD totalIDA blendIDA onlyIDA totalIndiaIndonesiaIran, Islamic Rep.IraqIrelandItalyJamaicaJapanJordanKazakhstanKenyaKorea, Dem. People’s Rep.Korea, Rep.KuwaitKyrgyz RepublicLao PDRLate-demographic dividendLatin America & Caribbean Latin America & Caribbean (excluding high income)Latin America & the Caribbean (IDA & IBRD countries)LatviaLeast developed countries: UN classificationLebanonLiberiaLibyaLithuaniaLow & middle incomeLow incomeLower middle incomeLuxembourgMacao SAR, ChinaMacedonia, FYRMadagascarMalawiMalaysiaMaldivesMaliMaltaMauritaniaMauritiusMexicoMiddle East & North AfricaMiddle East & North Africa (excluding high income)Middle East & North Africa (IDA & IBRD countries)Middle incomeMoldovaMongoliaMontenegroMoroccoMozambiqueMyanmarNepalNetherlandsNew CaledoniaNew ZealandNicaraguaNigerNigeriaNorth AmericaNorwayOECD membersOmanOther small statesPacific island small statesPakistanPanamaPapua New GuineaParaguayPeruPhilippinesPolandPortugalPost-demographic dividendPre-demographic dividendQatarRomaniaRussian FederationRwandaSaudi ArabiaSenegalSerbiaSeychellesSierra LeoneSingaporeSlovak RepublicSloveniaSmall statesSomaliaSouth AfricaSouth AsiaSouth Asia (IDA & IBRD)SpainSri LankaSt. LuciaSt. Vincent and the GrenadinesSub-Saharan Africa Sub-Saharan Africa (excluding high income)Sub-Saharan Africa (IDA & IBRD countries)SudanSurinameSwedenSwitzerlandSyrian Arab RepublicTajikistanTanzaniaThailandTogoTrinidad and TobagoTunisiaTurkeyTurkmenistanUgandaUkraineUnited Arab EmiratesUnited KingdomUnited StatesUpper middle incomeUruguayVenezuela, RBVietnamWorldYemen, Rep.ZambiaZimbabwe Timeline:
This timeline shows a graph from 1961 to 2015 of Nigeria. No data until 1960. Number of actual observations by date: 54.
Source name:
World Development Indicators
Source organization:
World Bank staff estimates based data from International Monetary Fund's Direction of Trade database.
Categories, topics:
Private Sector, Trade
Last updated:
apr 23, 2017
Indicators value changes by year
At the date of observation
Value
Absolute change
Change from previous value
jan 1, 1963
0.969
+0.969
%
jan 1, 1964
0.827
-0.142
-14.64%
jan 1, 1965
0.675
-0.152
-18.41%
jan 1, 1966
0.783
+0.108
15.96%
jan 1, 1967
0.334
-0.448
-57.28%
jan 1, 1968
0.463
+0.129
38.43%
jan 1, 1969
1.13
+0.667
144.14%
jan 1, 1970
1.524
+0.394
34.82%
jan 1, 1971
0.878
-0.645
-42.35%
jan 1, 1972
0.94
+0.062
7.05%
jan 1, 1973
0.778
-0.163
-17.32%
jan 1, 1974
0.602
-0.176
-22.6%
jan 1, 1975
0.562
-0.039
-6.55%
jan 1, 1976
0.365
-0.198
-35.15%
jan 1, 1977
0.218
-0.147
-40.25%
jan 1, 1978
0.199
-0.019
-8.82%
jan 1, 1979
0.293
+0.094
47.29%
jan 1, 1980
0.256
-0.036
-12.38%
jan 1, 1982
0.305
+0.049
18.94%
jan 1, 1983
0.324
+0.019
6.29%
jan 1, 1984
0.334
+0.01
2.98%
jan 1, 1985
0.288
-0.046
-13.79%
jan 1, 1986
0.189
-0.098
-34.19%
jan 1, 1987
0.424
+0.235
123.92%
jan 1, 1988
0.424
0.0
0.0%
jan 1, 1989
0.404
-0.02
-4.63%
jan 1, 1990
0.359
-0.046
-11.3%
jan 1, 1991
0.414
+0.056
15.5%
jan 1, 1992
0.991
+0.577
139.24%
jan 1, 1993
1.84
+0.848
85.58%
jan 1, 1994
1.249
-0.59
-32.09%
jan 1, 1995
2.019
+0.77
61.59%
jan 1, 1996
0.36
-1.659
-82.16%
jan 1, 1997
3.228
+2.868
796.02%
jan 1, 1998
0.96
-2.268
-70.25%
jan 1, 1999
0.471
-0.489
-50.94%
jan 1, 2000
0.829
+0.357
75.83%
jan 1, 2001
2.396
+1.567
189.16%
jan 1, 2002
2.5
+0.104
4.35%
jan 1, 2003
2.282
-0.218
-8.73%
jan 1, 2004
3.067
+0.785
34.41%
jan 1, 2005
2.982
-0.085
-2.77%
jan 1, 2006
3.132
+0.15
5.04%
jan 1, 2007
2.965
-0.168
-5.35%
jan 1, 2008
2.724
-0.241
-8.13%
jan 1, 2009
3.625
+0.901
33.08%
jan 1, 2010
2.427
-1.198
-33.04%
jan 1, 2011
3.009
+0.582
23.96%
jan 1, 2012
2.882
-0.127
-4.22%
jan 1, 2013
3.301
+0.419
14.54%
jan 1, 2014
2.946
-0.355
-10.75%
jan 1, 2015
2.981
+0.036
1.21%
Ranking of countries by current statistics by years


Comments: