29
/
en
AIzaSyAYiBZKx7MnpbEhh9jyipgxe19OcubqV5w
April 1, 2024
188080
Malaysia
MYS
true
2
1
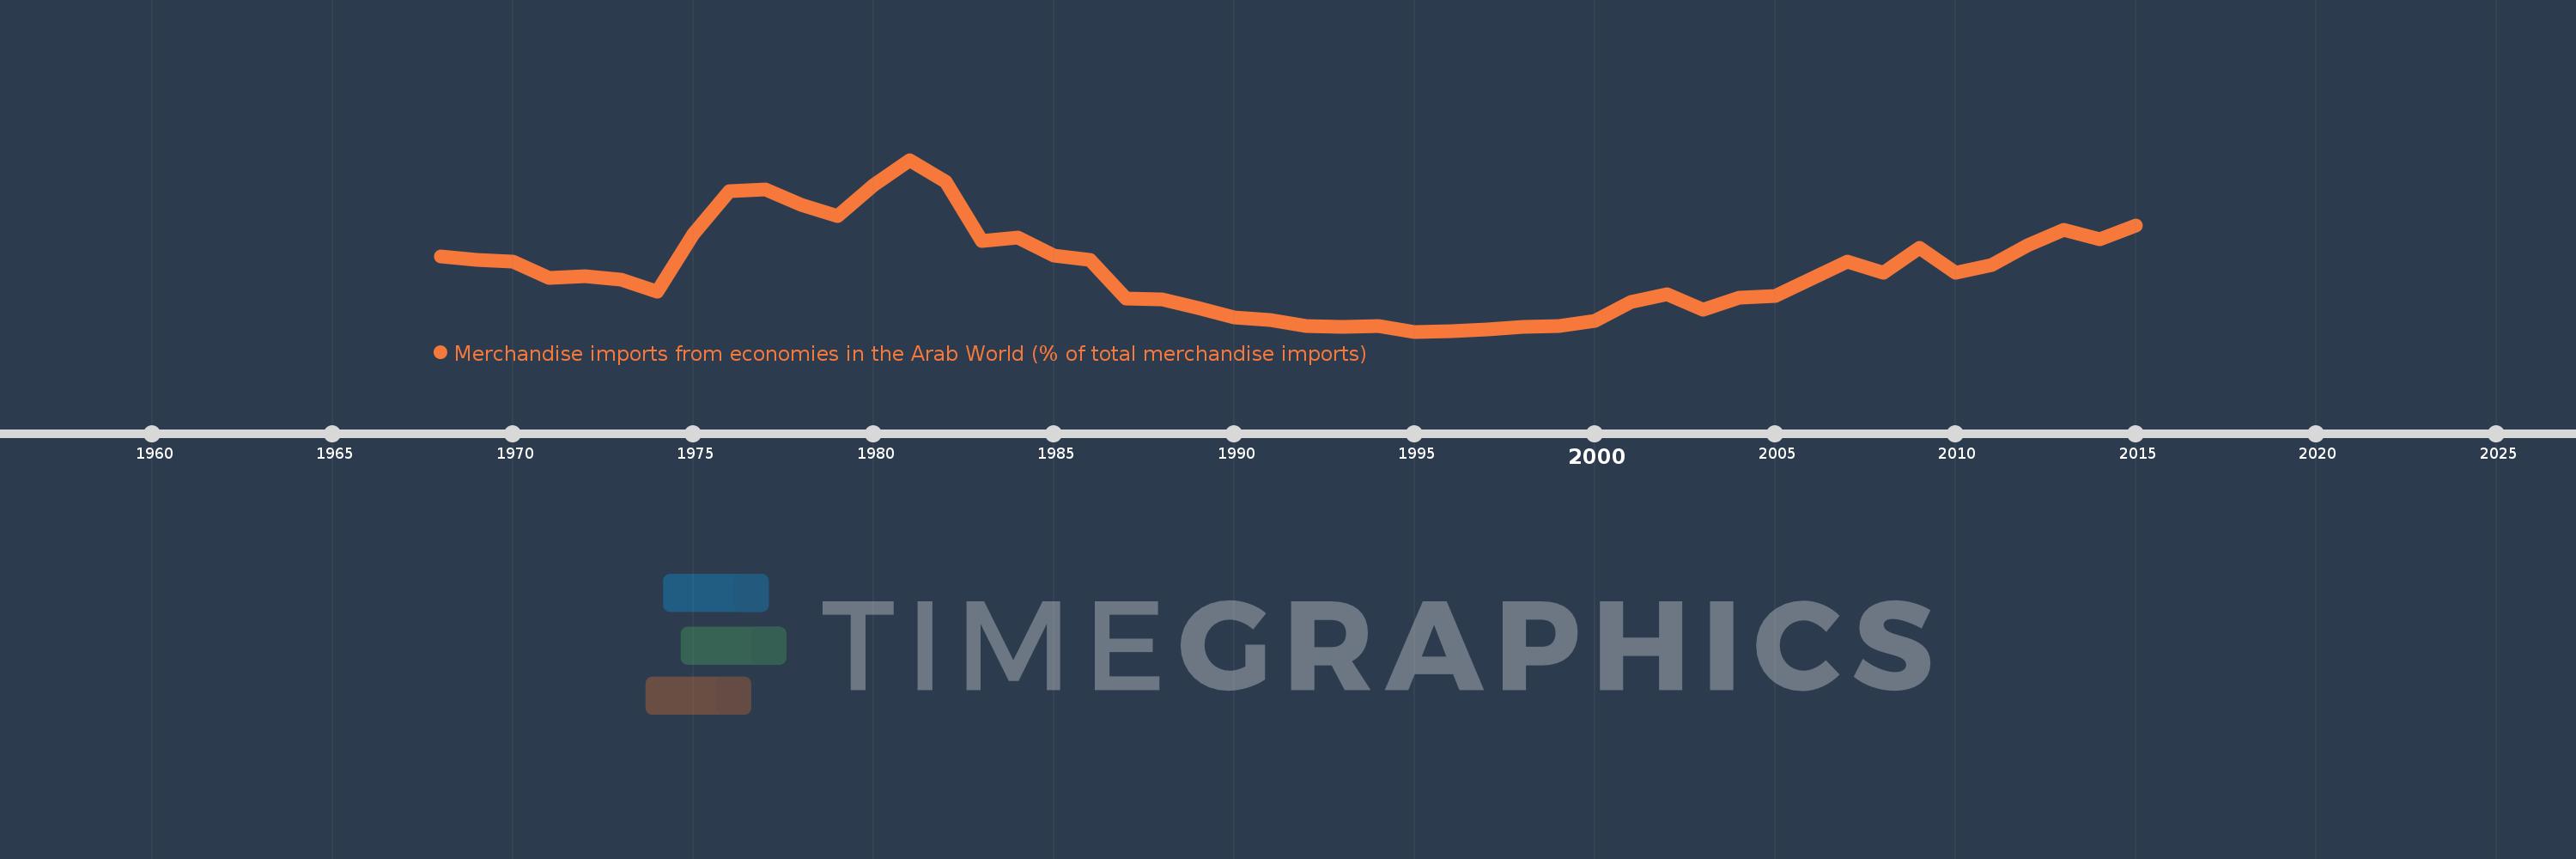
Merchandise imports from economies in the Arab World (% of total merchandise imports)
2015,2014,2013,2012,2011,2010,2009,2008,2007,2006,2005,2004,2003,2002,2001,2000,1999,1998,1997,1996,1995,1994,1993,1992,1991,1990,1989,1988,1987,1986,1985,1984,1983,1982,1981,1980,1979,1978,1977,1976,1975,1974,1973,1972,1971,1970,1969,1968
This statistics in other country:
AfghanistanAlbaniaAlgeriaAngolaArab WorldArgentinaArmeniaArubaAustraliaAustriaAzerbaijanBahamas, TheBahrainBangladeshBarbadosBelarusBelgiumBelizeBeninBermudaBoliviaBrazilBrunei DarussalamBulgariaBurkina FasoBurundiCabo VerdeCambodiaCameroonCanadaCaribbean small statesCentral African RepublicCentral Europe and the BalticsChadChileChinaColombiaComorosCongo, Dem. Rep.Congo, Rep.Costa RicaCote d'IvoireCroatiaCubaCyprusCzech RepublicDenmarkDjiboutiDominicaDominican RepublicEarly-demographic dividendEast Asia & PacificEast Asia & Pacific (excluding high income)East Asia & Pacific (IDA & IBRD countries)EcuadorEgypt, Arab Rep.El SalvadorEstoniaEthiopiaEuro areaEurope & Central AsiaEurope & Central Asia (excluding high income)Europe & Central Asia (IDA & IBRD countries)European UnionFijiFinlandFragile and conflict affected situationsFranceFrench PolynesiaGabonGambia, TheGeorgiaGermanyGhanaGreeceGreenlandGrenadaGuatemalaGuineaGuinea-BissauGuyanaHaitiHeavily indebted poor countries (HIPC)High incomeHondurasHong Kong SAR, ChinaHungaryIBRD onlyIcelandIDA & IBRD totalIDA blendIDA onlyIDA totalIndiaIndonesiaIran, Islamic Rep.IraqIrelandItalyJamaicaJapanJordanKazakhstanKenyaKorea, Dem. People’s Rep.Korea, Rep.KuwaitKyrgyz RepublicLao PDRLate-demographic dividendLatin America & Caribbean Latin America & Caribbean (excluding high income)Latin America & the Caribbean (IDA & IBRD countries)LatviaLeast developed countries: UN classificationLebanonLiberiaLibyaLithuaniaLow & middle incomeLow incomeLower middle incomeLuxembourgMacao SAR, ChinaMacedonia, FYRMadagascarMalawiMalaysiaMaldivesMaliMaltaMauritaniaMauritiusMexicoMiddle East & North AfricaMiddle East & North Africa (excluding high income)Middle East & North Africa (IDA & IBRD countries)Middle incomeMoldovaMongoliaMontenegroMoroccoMozambiqueMyanmarNepalNetherlandsNew CaledoniaNew ZealandNicaraguaNigerNigeriaNorth AmericaNorwayOECD membersOmanOther small statesPacific island small statesPakistanPanamaPapua New GuineaParaguayPeruPhilippinesPolandPortugalPost-demographic dividendPre-demographic dividendQatarRomaniaRussian FederationRwandaSaudi ArabiaSenegalSerbiaSeychellesSierra LeoneSingaporeSlovak RepublicSloveniaSmall statesSomaliaSouth AfricaSouth AsiaSouth Asia (IDA & IBRD)SpainSri LankaSt. LuciaSt. Vincent and the GrenadinesSub-Saharan Africa Sub-Saharan Africa (excluding high income)Sub-Saharan Africa (IDA & IBRD countries)SudanSurinameSwedenSwitzerlandSyrian Arab RepublicTajikistanTanzaniaThailandTogoTrinidad and TobagoTunisiaTurkeyTurkmenistanUgandaUkraineUnited Arab EmiratesUnited KingdomUnited StatesUpper middle incomeUruguayVenezuela, RBVietnamWorldYemen, Rep.ZambiaZimbabwe Timeline:
This timeline shows a graph from 1968 to 2015 of Malaysia. No data until 1967. Number of actual observations by date: 48.
Source name:
World Development Indicators
Source organization:
World Bank staff estimates based data from International Monetary Fund's Direction of Trade database.
Categories, topics:
Private Sector, Trade
Last updated:
apr 23, 2017
Indicators value changes by year
At the date of observation
Value
Absolute change
Change from previous value
jan 1, 1968
4.023
+4.023
0.0%
jan 1, 1969
3.886
-0.137
-3.41%
jan 1, 1970
3.798
-0.088
-2.25%
jan 1, 1971
3.048
-0.75
-19.75%
jan 1, 1972
3.13
+0.082
2.68%
jan 1, 1973
2.959
-0.171
-5.47%
jan 1, 1974
2.413
-0.545
-18.43%
jan 1, 1975
5.056
+2.642
109.47%
jan 1, 1976
7.039
+1.983
39.22%
jan 1, 1977
7.138
+0.1
1.42%
jan 1, 1978
6.436
-0.702
-9.83%
jan 1, 1979
5.914
-0.522
-8.12%
jan 1, 1980
7.318
+1.404
23.74%
jan 1, 1981
8.506
+1.188
16.23%
jan 1, 1982
7.493
-1.013
-11.91%
jan 1, 1983
4.732
-2.761
-36.85%
jan 1, 1984
4.901
+0.169
3.56%
jan 1, 1985
4.057
-0.844
-17.22%
jan 1, 1986
3.881
-0.176
-4.34%
jan 1, 1987
2.099
-1.782
-45.92%
jan 1, 1988
2.064
-0.035
-1.65%
jan 1, 1989
1.659
-0.405
-19.63%
jan 1, 1990
1.195
-0.464
-27.94%
jan 1, 1991
1.093
-0.102
-8.57%
jan 1, 1992
0.83
-0.263
-24.08%
jan 1, 1993
0.795
-0.035
-4.22%
jan 1, 1994
0.815
+0.02
2.5%
jan 1, 1995
0.559
-0.256
-31.44%
jan 1, 1996
0.569
+0.01
1.84%
jan 1, 1997
0.645
+0.076
13.45%
jan 1, 1998
0.77
+0.124
19.28%
jan 1, 1999
0.836
+0.066
8.6%
jan 1, 2000
1.05
+0.214
25.59%
jan 1, 2001
1.918
+0.868
82.68%
jan 1, 2002
2.287
+0.37
19.27%
jan 1, 2003
1.575
-0.712
-31.13%
jan 1, 2004
2.113
+0.538
34.13%
jan 1, 2005
2.193
+0.08
3.8%
jan 1, 2006
3.013
+0.82
37.39%
jan 1, 2007
3.808
+0.794
26.36%
jan 1, 2008
3.295
-0.512
-13.45%
jan 1, 2009
4.448
+1.152
34.96%
jan 1, 2010
3.296
-1.151
-25.88%
jan 1, 2011
3.632
+0.335
10.17%
jan 1, 2012
4.54
+0.908
25.01%
jan 1, 2013
5.269
+0.729
16.05%
jan 1, 2014
4.847
-0.422
-8.01%
jan 1, 2015
5.477
+0.63
13.0%
Ranking of countries by current statistics by years


Comments: