29
/
en
AIzaSyAYiBZKx7MnpbEhh9jyipgxe19OcubqV5w
April 1, 2024
134367
France
FRA
true
2
1
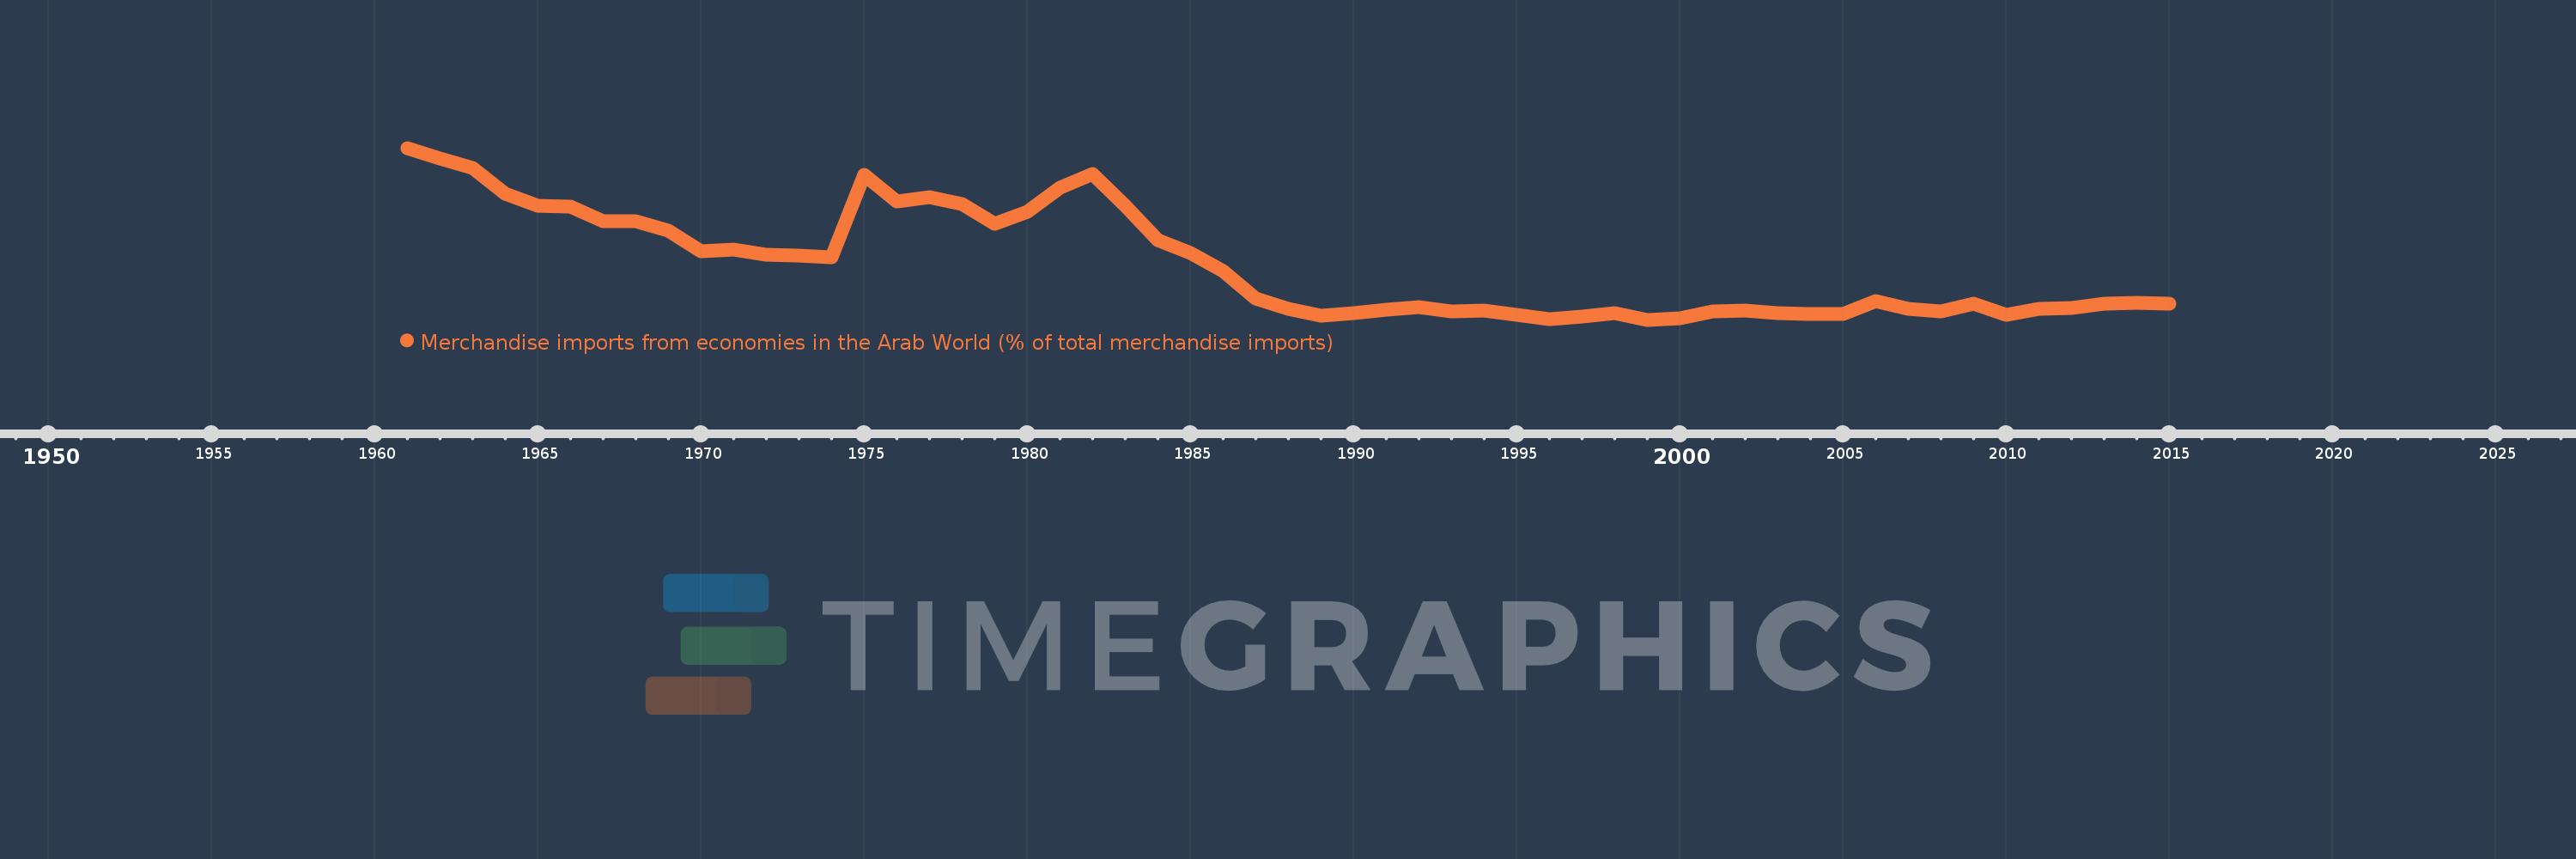
Merchandise imports from economies in the Arab World (% of total merchandise imports)
2015,2014,2013,2012,2011,2010,2009,2008,2007,2006,2005,2004,2003,2002,2001,2000,1999,1998,1997,1996,1995,1994,1993,1992,1991,1990,1989,1988,1987,1986,1985,1984,1983,1982,1981,1980,1979,1978,1977,1976,1975,1974,1973,1972,1971,1970,1969,1968,1967,1966,1965,1964,1963,1962,1961
This statistics in other country:
AfghanistanAlbaniaAlgeriaAngolaArab WorldArgentinaArmeniaArubaAustraliaAustriaAzerbaijanBahamas, TheBahrainBangladeshBarbadosBelarusBelgiumBelizeBeninBermudaBoliviaBrazilBrunei DarussalamBulgariaBurkina FasoBurundiCabo VerdeCambodiaCameroonCanadaCaribbean small statesCentral African RepublicCentral Europe and the BalticsChadChileChinaColombiaComorosCongo, Dem. Rep.Congo, Rep.Costa RicaCote d'IvoireCroatiaCubaCyprusCzech RepublicDenmarkDjiboutiDominicaDominican RepublicEarly-demographic dividendEast Asia & PacificEast Asia & Pacific (excluding high income)East Asia & Pacific (IDA & IBRD countries)EcuadorEgypt, Arab Rep.El SalvadorEstoniaEthiopiaEuro areaEurope & Central AsiaEurope & Central Asia (excluding high income)Europe & Central Asia (IDA & IBRD countries)European UnionFijiFinlandFragile and conflict affected situationsFranceFrench PolynesiaGabonGambia, TheGeorgiaGermanyGhanaGreeceGreenlandGrenadaGuatemalaGuineaGuinea-BissauGuyanaHaitiHeavily indebted poor countries (HIPC)High incomeHondurasHong Kong SAR, ChinaHungaryIBRD onlyIcelandIDA & IBRD totalIDA blendIDA onlyIDA totalIndiaIndonesiaIran, Islamic Rep.IraqIrelandItalyJamaicaJapanJordanKazakhstanKenyaKorea, Dem. People’s Rep.Korea, Rep.KuwaitKyrgyz RepublicLao PDRLate-demographic dividendLatin America & Caribbean Latin America & Caribbean (excluding high income)Latin America & the Caribbean (IDA & IBRD countries)LatviaLeast developed countries: UN classificationLebanonLiberiaLibyaLithuaniaLow & middle incomeLow incomeLower middle incomeLuxembourgMacao SAR, ChinaMacedonia, FYRMadagascarMalawiMalaysiaMaldivesMaliMaltaMauritaniaMauritiusMexicoMiddle East & North AfricaMiddle East & North Africa (excluding high income)Middle East & North Africa (IDA & IBRD countries)Middle incomeMoldovaMongoliaMontenegroMoroccoMozambiqueMyanmarNepalNetherlandsNew CaledoniaNew ZealandNicaraguaNigerNigeriaNorth AmericaNorwayOECD membersOmanOther small statesPacific island small statesPakistanPanamaPapua New GuineaParaguayPeruPhilippinesPolandPortugalPost-demographic dividendPre-demographic dividendQatarRomaniaRussian FederationRwandaSaudi ArabiaSenegalSerbiaSeychellesSierra LeoneSingaporeSlovak RepublicSloveniaSmall statesSomaliaSouth AfricaSouth AsiaSouth Asia (IDA & IBRD)SpainSri LankaSt. LuciaSt. Vincent and the GrenadinesSub-Saharan Africa Sub-Saharan Africa (excluding high income)Sub-Saharan Africa (IDA & IBRD countries)SudanSurinameSwedenSwitzerlandSyrian Arab RepublicTajikistanTanzaniaThailandTogoTrinidad and TobagoTunisiaTurkeyTurkmenistanUgandaUkraineUnited Arab EmiratesUnited KingdomUnited StatesUpper middle incomeUruguayVenezuela, RBVietnamWorldYemen, Rep.ZambiaZimbabwe Timeline:
This timeline shows a graph from 1961 to 2015 of France. No data until 1960. Number of actual observations by date: 55.
Source name:
World Development Indicators
Source organization:
World Bank staff estimates based data from International Monetary Fund's Direction of Trade database.
Categories, topics:
Private Sector, Trade
Last updated:
apr 23, 2017
Indicators value changes by year
Maximum:
19.858
jan 1, 1961
At the date of observation
Value
Absolute change
Change from previous value
jan 1, 1961
19.858
+19.858
0.0%
jan 1, 1962
18.871
-0.986
-4.97%
jan 1, 1963
17.932
-0.939
-4.98%
jan 1, 1964
15.509
-2.423
-13.51%
jan 1, 1965
14.344
-1.165
-7.51%
jan 1, 1966
14.209
-0.135
-0.94%
jan 1, 1967
12.817
-1.392
-9.79%
jan 1, 1968
12.83
+0.013
0.1%
jan 1, 1969
11.936
-0.894
-6.97%
jan 1, 1970
9.976
-1.96
-16.42%
jan 1, 1971
10.13
+0.154
1.54%
jan 1, 1972
9.653
-0.477
-4.7%
jan 1, 1973
9.524
-0.13
-1.34%
jan 1, 1974
9.37
-0.153
-1.61%
jan 1, 1975
17.271
+7.9
84.31%
jan 1, 1976
14.719
-2.552
-14.78%
jan 1, 1977
15.132
+0.413
2.81%
jan 1, 1978
14.468
-0.663
-4.38%
jan 1, 1979
12.574
-1.894
-13.09%
jan 1, 1980
13.733
+1.159
9.22%
jan 1, 1981
16.081
+2.348
17.1%
jan 1, 1982
17.36
+1.279
7.95%
jan 1, 1983
14.286
-3.075
-17.71%
jan 1, 1984
11.038
-3.248
-22.73%
jan 1, 1985
9.769
-1.269
-11.49%
jan 1, 1986
8.028
-1.741
-17.82%
jan 1, 1987
5.426
-2.602
-32.41%
jan 1, 1988
4.418
-1.008
-18.58%
jan 1, 1989
3.774
-0.644
-14.58%
jan 1, 1990
4.051
+0.276
7.32%
jan 1, 1991
4.384
+0.333
8.21%
jan 1, 1992
4.633
+0.249
5.69%
jan 1, 1993
4.166
-0.467
-10.08%
jan 1, 1994
4.236
+0.07
1.69%
jan 1, 1995
3.867
-0.369
-8.71%
jan 1, 1996
3.418
-0.45
-11.62%
jan 1, 1997
3.695
+0.277
8.11%
jan 1, 1998
4.02
+0.325
8.78%
jan 1, 1999
3.385
-0.635
-15.79%
jan 1, 2000
3.548
+0.163
4.82%
jan 1, 2001
4.222
+0.674
19.0%
jan 1, 2002
4.273
+0.051
1.22%
jan 1, 2003
4.0
-0.273
-6.39%
jan 1, 2004
3.964
-0.036
-0.91%
jan 1, 2005
3.973
+0.009
0.23%
jan 1, 2006
5.157
+1.184
29.81%
jan 1, 2007
4.395
-0.762
-14.77%
jan 1, 2008
4.147
-0.248
-5.64%
jan 1, 2009
4.935
+0.788
18.99%
jan 1, 2010
3.891
-1.044
-21.16%
jan 1, 2011
4.46
+0.569
14.62%
jan 1, 2012
4.496
+0.036
0.81%
jan 1, 2013
4.899
+0.403
8.96%
jan 1, 2014
5.003
+0.105
2.14%
jan 1, 2015
4.918
-0.086
-1.71%
Ranking of countries by current statistics by years


Comments: