29
/
en
AIzaSyAYiBZKx7MnpbEhh9jyipgxe19OcubqV5w
April 1, 2024
286173
Zambia
ZMB
true
2
1
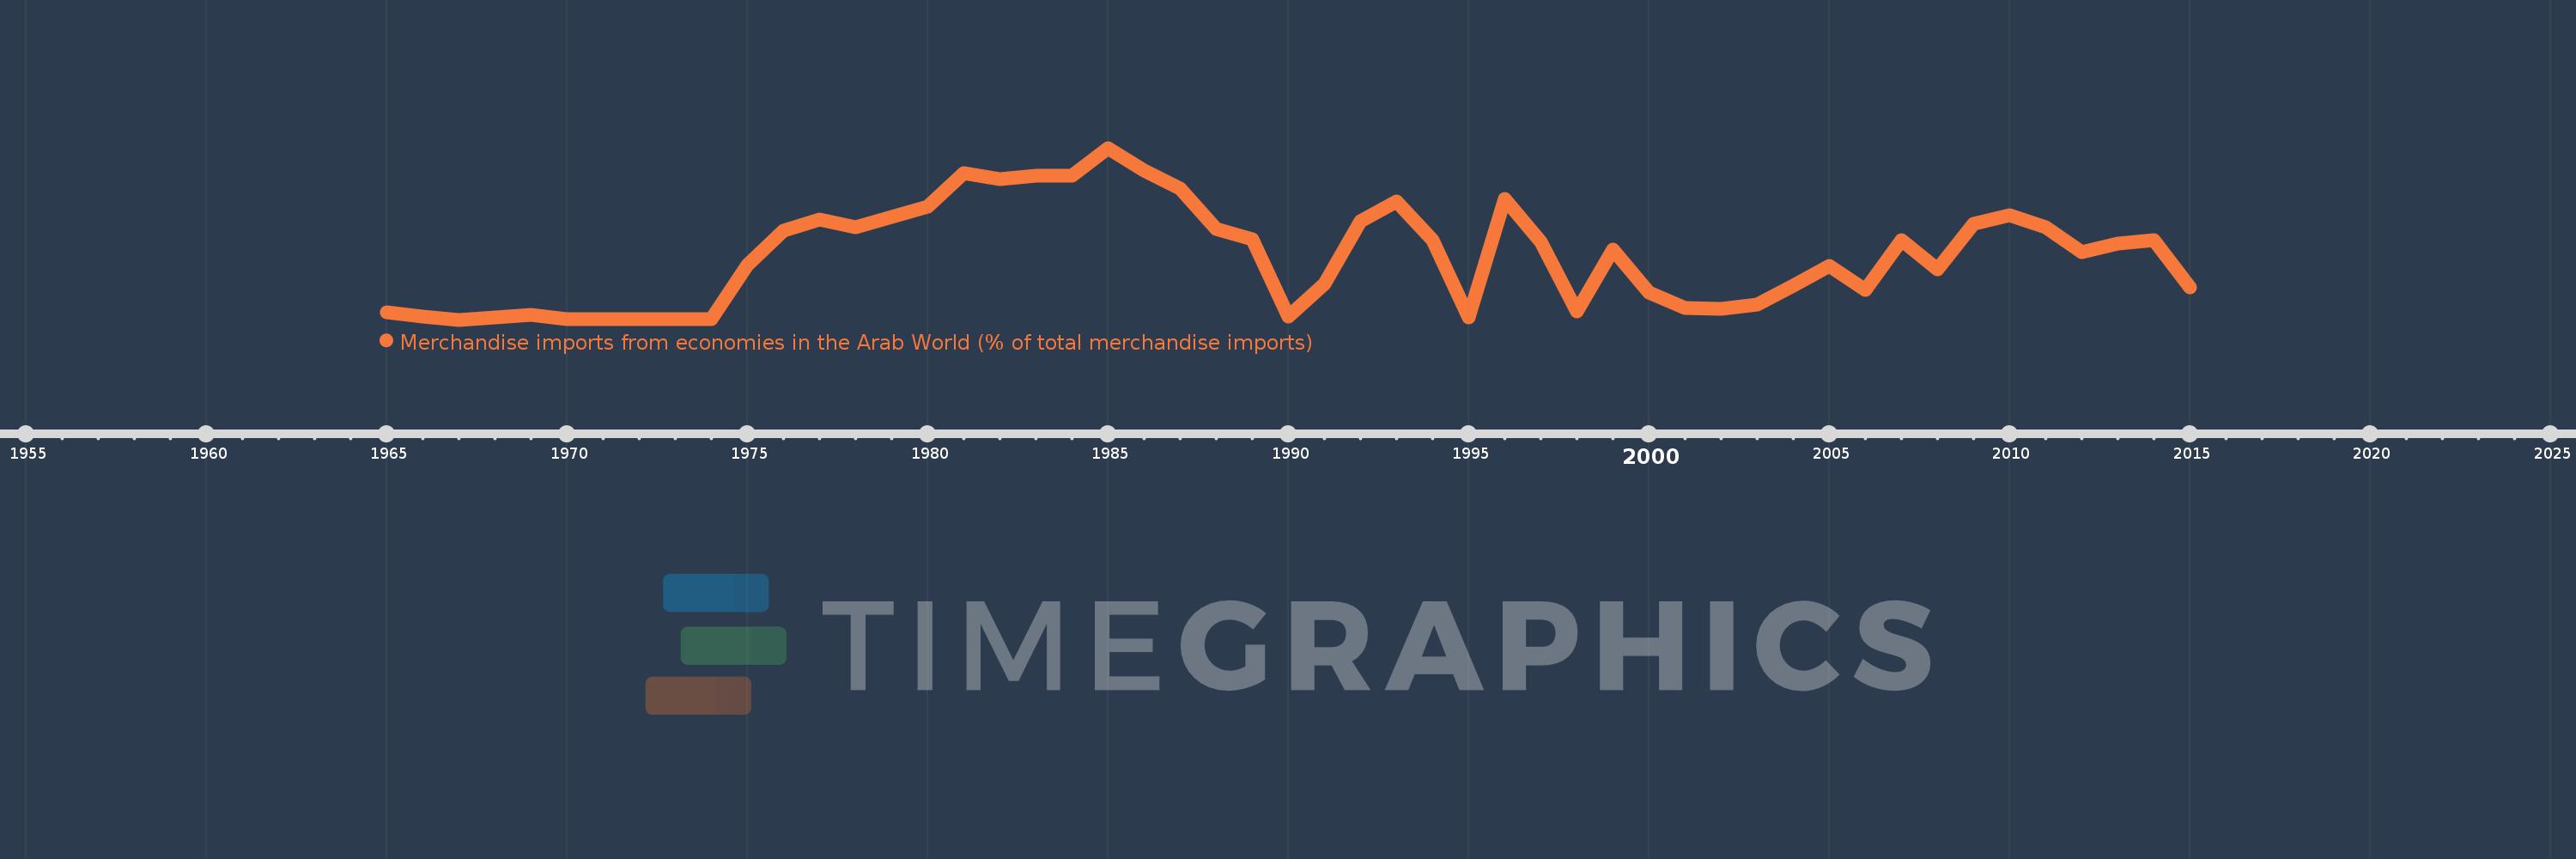
Merchandise imports from economies in the Arab World (% of total merchandise imports)
2015,2014,2013,2012,2011,2010,2009,2008,2007,2006,2005,2004,2003,2002,2001,2000,1999,1998,1997,1996,1995,1994,1993,1992,1991,1990,1989,1988,1987,1986,1985,1984,1983,1982,1981,1980,1979,1978,1977,1976,1975,1974,1973,1972,1971,1970,1969,1968,1967,1966,1965
This statistics in other country:
AfghanistanAlbaniaAlgeriaAngolaArab WorldArgentinaArmeniaArubaAustraliaAustriaAzerbaijanBahamas, TheBahrainBangladeshBarbadosBelarusBelgiumBelizeBeninBermudaBoliviaBrazilBrunei DarussalamBulgariaBurkina FasoBurundiCabo VerdeCambodiaCameroonCanadaCaribbean small statesCentral African RepublicCentral Europe and the BalticsChadChileChinaColombiaComorosCongo, Dem. Rep.Congo, Rep.Costa RicaCote d'IvoireCroatiaCubaCyprusCzech RepublicDenmarkDjiboutiDominicaDominican RepublicEarly-demographic dividendEast Asia & PacificEast Asia & Pacific (excluding high income)East Asia & Pacific (IDA & IBRD countries)EcuadorEgypt, Arab Rep.El SalvadorEstoniaEthiopiaEuro areaEurope & Central AsiaEurope & Central Asia (excluding high income)Europe & Central Asia (IDA & IBRD countries)European UnionFijiFinlandFragile and conflict affected situationsFranceFrench PolynesiaGabonGambia, TheGeorgiaGermanyGhanaGreeceGreenlandGrenadaGuatemalaGuineaGuinea-BissauGuyanaHaitiHeavily indebted poor countries (HIPC)High incomeHondurasHong Kong SAR, ChinaHungaryIBRD onlyIcelandIDA & IBRD totalIDA blendIDA onlyIDA totalIndiaIndonesiaIran, Islamic Rep.IraqIrelandItalyJamaicaJapanJordanKazakhstanKenyaKorea, Dem. People’s Rep.Korea, Rep.KuwaitKyrgyz RepublicLao PDRLate-demographic dividendLatin America & Caribbean Latin America & Caribbean (excluding high income)Latin America & the Caribbean (IDA & IBRD countries)LatviaLeast developed countries: UN classificationLebanonLiberiaLibyaLithuaniaLow & middle incomeLow incomeLower middle incomeLuxembourgMacao SAR, ChinaMacedonia, FYRMadagascarMalawiMalaysiaMaldivesMaliMaltaMauritaniaMauritiusMexicoMiddle East & North AfricaMiddle East & North Africa (excluding high income)Middle East & North Africa (IDA & IBRD countries)Middle incomeMoldovaMongoliaMontenegroMoroccoMozambiqueMyanmarNepalNetherlandsNew CaledoniaNew ZealandNicaraguaNigerNigeriaNorth AmericaNorwayOECD membersOmanOther small statesPacific island small statesPakistanPanamaPapua New GuineaParaguayPeruPhilippinesPolandPortugalPost-demographic dividendPre-demographic dividendQatarRomaniaRussian FederationRwandaSaudi ArabiaSenegalSerbiaSeychellesSierra LeoneSingaporeSlovak RepublicSloveniaSmall statesSomaliaSouth AfricaSouth AsiaSouth Asia (IDA & IBRD)SpainSri LankaSt. LuciaSt. Vincent and the GrenadinesSub-Saharan Africa Sub-Saharan Africa (excluding high income)Sub-Saharan Africa (IDA & IBRD countries)SudanSurinameSwedenSwitzerlandSyrian Arab RepublicTajikistanTanzaniaThailandTogoTrinidad and TobagoTunisiaTurkeyTurkmenistanUgandaUkraineUnited Arab EmiratesUnited KingdomUnited StatesUpper middle incomeUruguayVenezuela, RBVietnamWorldYemen, Rep.ZambiaZimbabwe Timeline:
This timeline shows a graph from 1965 to 2015 of Zambia. No data until 1964. Number of actual observations by date: 51.
Source name:
World Development Indicators
Source organization:
World Bank staff estimates based data from International Monetary Fund's Direction of Trade database.
Categories, topics:
Private Sector, Trade
Last updated:
apr 23, 2017
Indicators value changes by year
Maximum:
23.039
jan 1, 1985
At the date of observation
Value
Absolute change
Change from previous value
jan 1, 1965
1.012
+1.012
0.0%
jan 1, 1966
0.477
-0.535
-52.88%
jan 1, 1967
0.058
-0.418
-87.76%
jan 1, 1968
0.401
+0.342
586.49%
jan 1, 1969
0.698
+0.298
74.33%
jan 1, 1970
0.194
-0.505
-72.27%
jan 1, 1971
0.123
-0.071
-36.63%
jan 1, 1972
0.121
-0.001
-1.15%
jan 1, 1973
0.189
+0.067
55.45%
jan 1, 1974
0.189
+0.0
0.06%
jan 1, 1975
7.397
+7.208
3.82K%
jan 1, 1976
11.939
+4.542
61.41%
jan 1, 1977
13.444
+1.505
12.61%
jan 1, 1978
12.465
-0.979
-7.28%
jan 1, 1979
13.854
+1.388
11.14%
jan 1, 1980
15.168
+1.314
9.49%
jan 1, 1981
19.652
+4.484
29.56%
jan 1, 1982
18.811
-0.841
-4.28%
jan 1, 1983
19.379
+0.568
3.02%
jan 1, 1984
19.379
+0.0
0.0%
jan 1, 1985
23.039
+3.66
18.89%
jan 1, 1986
20.021
-3.018
-13.1%
jan 1, 1987
17.623
-2.398
-11.98%
jan 1, 1988
12.239
-5.384
-30.55%
jan 1, 1989
10.781
-1.458
-11.91%
jan 1, 1990
0.478
-10.303
-95.56%
jan 1, 1991
4.825
+4.347
908.96%
jan 1, 1992
13.276
+8.451
175.12%
jan 1, 1993
15.858
+2.582
19.45%
jan 1, 1994
10.711
-5.147
-32.46%
jan 1, 1995
0.358
-10.353
-96.65%
jan 1, 1996
16.257
+15.899
4.44K%
jan 1, 1997
10.425
-5.832
-35.87%
jan 1, 1998
1.168
-9.257
-88.79%
jan 1, 1999
9.41
+8.242
705.36%
jan 1, 2000
3.685
-5.726
-60.84%
jan 1, 2001
1.664
-2.021
-54.84%
jan 1, 2002
1.541
-0.123
-7.38%
jan 1, 2003
2.077
+0.535
34.73%
jan 1, 2004
4.596
+2.519
121.32%
jan 1, 2005
7.241
+2.645
57.55%
jan 1, 2006
4.086
-3.155
-43.58%
jan 1, 2007
10.752
+6.667
163.18%
jan 1, 2008
6.834
-3.918
-36.44%
jan 1, 2009
12.899
+6.064
88.73%
jan 1, 2010
14.077
+1.178
9.14%
jan 1, 2011
12.403
-1.675
-11.9%
jan 1, 2012
9.092
-3.311
-26.7%
jan 1, 2013
10.254
+1.162
12.78%
jan 1, 2014
10.665
+0.411
4.01%
jan 1, 2015
4.34
-6.325
-59.31%
Ranking of countries by current statistics by years


Comments: