29
/
en
AIzaSyAYiBZKx7MnpbEhh9jyipgxe19OcubqV5w
April 1, 2024
204347
Myanmar
MMR
true
2
1
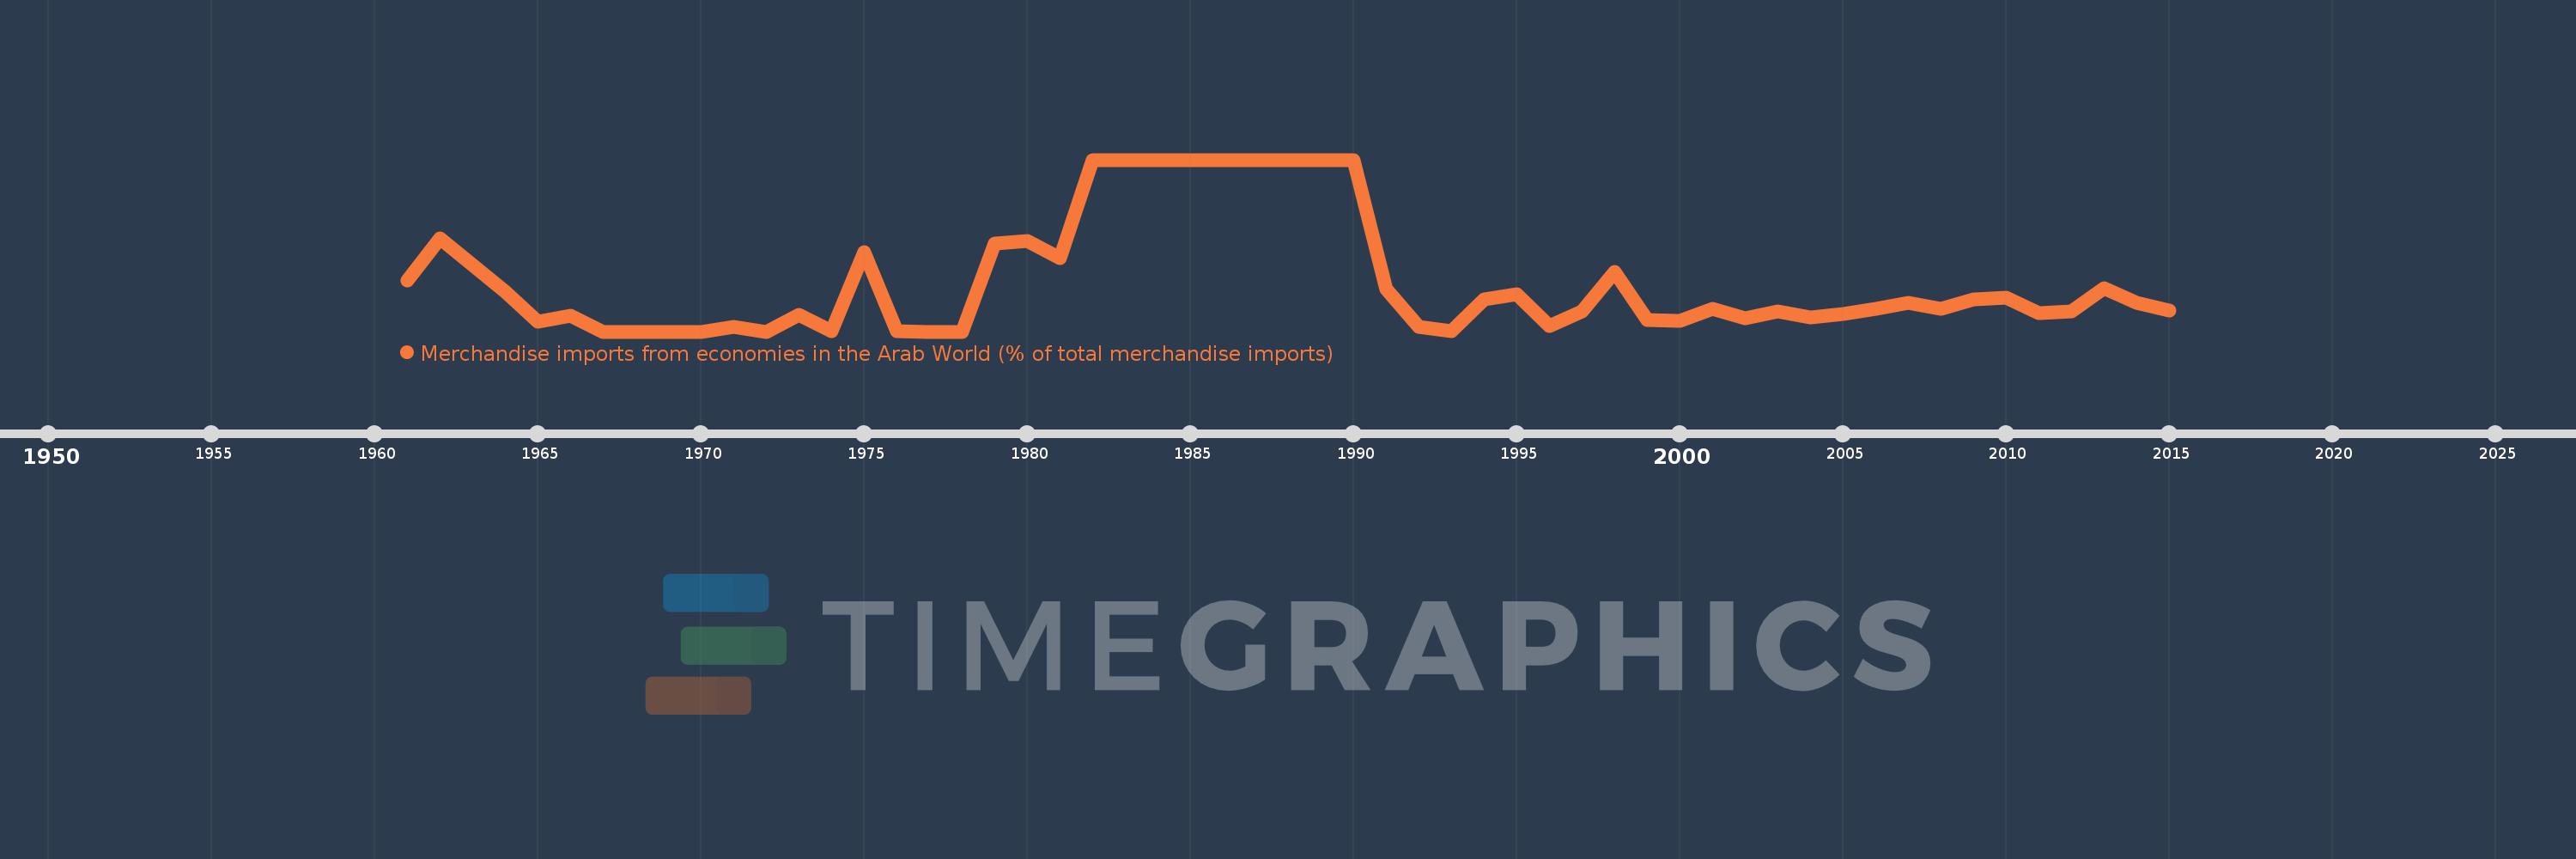
Merchandise imports from economies in the Arab World (% of total merchandise imports)
2015,2014,2013,2012,2011,2010,2009,2008,2007,2006,2005,2004,2003,2002,2001,2000,1999,1998,1997,1996,1995,1994,1993,1992,1991,1990,1989,1988,1987,1986,1985,1984,1983,1982,1981,1980,1979,1978,1977,1976,1975,1974,1973,1972,1971,1970,1969,1968,1967,1966,1965,1964,1963,1962,1961
This statistics in other country:
AfghanistanAlbaniaAlgeriaAngolaArab WorldArgentinaArmeniaArubaAustraliaAustriaAzerbaijanBahamas, TheBahrainBangladeshBarbadosBelarusBelgiumBelizeBeninBermudaBoliviaBrazilBrunei DarussalamBulgariaBurkina FasoBurundiCabo VerdeCambodiaCameroonCanadaCaribbean small statesCentral African RepublicCentral Europe and the BalticsChadChileChinaColombiaComorosCongo, Dem. Rep.Congo, Rep.Costa RicaCote d'IvoireCroatiaCubaCyprusCzech RepublicDenmarkDjiboutiDominicaDominican RepublicEarly-demographic dividendEast Asia & PacificEast Asia & Pacific (excluding high income)East Asia & Pacific (IDA & IBRD countries)EcuadorEgypt, Arab Rep.El SalvadorEstoniaEthiopiaEuro areaEurope & Central AsiaEurope & Central Asia (excluding high income)Europe & Central Asia (IDA & IBRD countries)European UnionFijiFinlandFragile and conflict affected situationsFranceFrench PolynesiaGabonGambia, TheGeorgiaGermanyGhanaGreeceGreenlandGrenadaGuatemalaGuineaGuinea-BissauGuyanaHaitiHeavily indebted poor countries (HIPC)High incomeHondurasHong Kong SAR, ChinaHungaryIBRD onlyIcelandIDA & IBRD totalIDA blendIDA onlyIDA totalIndiaIndonesiaIran, Islamic Rep.IraqIrelandItalyJamaicaJapanJordanKazakhstanKenyaKorea, Dem. People’s Rep.Korea, Rep.KuwaitKyrgyz RepublicLao PDRLate-demographic dividendLatin America & Caribbean Latin America & Caribbean (excluding high income)Latin America & the Caribbean (IDA & IBRD countries)LatviaLeast developed countries: UN classificationLebanonLiberiaLibyaLithuaniaLow & middle incomeLow incomeLower middle incomeLuxembourgMacao SAR, ChinaMacedonia, FYRMadagascarMalawiMalaysiaMaldivesMaliMaltaMauritaniaMauritiusMexicoMiddle East & North AfricaMiddle East & North Africa (excluding high income)Middle East & North Africa (IDA & IBRD countries)Middle incomeMoldovaMongoliaMontenegroMoroccoMozambiqueMyanmarNepalNetherlandsNew CaledoniaNew ZealandNicaraguaNigerNigeriaNorth AmericaNorwayOECD membersOmanOther small statesPacific island small statesPakistanPanamaPapua New GuineaParaguayPeruPhilippinesPolandPortugalPost-demographic dividendPre-demographic dividendQatarRomaniaRussian FederationRwandaSaudi ArabiaSenegalSerbiaSeychellesSierra LeoneSingaporeSlovak RepublicSloveniaSmall statesSomaliaSouth AfricaSouth AsiaSouth Asia (IDA & IBRD)SpainSri LankaSt. LuciaSt. Vincent and the GrenadinesSub-Saharan Africa Sub-Saharan Africa (excluding high income)Sub-Saharan Africa (IDA & IBRD countries)SudanSurinameSwedenSwitzerlandSyrian Arab RepublicTajikistanTanzaniaThailandTogoTrinidad and TobagoTunisiaTurkeyTurkmenistanUgandaUkraineUnited Arab EmiratesUnited KingdomUnited StatesUpper middle incomeUruguayVenezuela, RBVietnamWorldYemen, Rep.ZambiaZimbabwe Timeline:
This timeline shows a graph from 1961 to 2015 of Myanmar. No data until 1960. Number of actual observations by date: 55.
Source name:
World Development Indicators
Source organization:
World Bank staff estimates based data from International Monetary Fund's Direction of Trade database.
Categories, topics:
Private Sector, Trade
Last updated:
apr 23, 2017
Indicators value changes by year
At the date of observation
Value
Absolute change
Change from previous value
jan 1, 1961
0.391
+0.391
0.0%
jan 1, 1962
0.713
+0.322
82.31%
jan 1, 1963
0.51
-0.204
-28.54%
jan 1, 1964
0.303
-0.206
-40.47%
jan 1, 1965
0.076
-0.228
-75.1%
jan 1, 1966
0.124
+0.048
64.14%
jan 1, 1967
0.0
-0.124
-100.0%
jan 1, 1971
0.035
+0.035
%
jan 1, 1972
0.0
-0.035
-100.0%
jan 1, 1973
0.127
+0.127
%
jan 1, 1974
0.002
-0.126
-98.52%
jan 1, 1975
0.608
+0.606
32.24K%
jan 1, 1976
0.001
-0.607
-99.87%
jan 1, 1977
0.0
-0.001
-100.0%
jan 1, 1980
0.691
+0.021
3.13%
jan 1, 1981
0.561
-0.13
-18.8%
jan 1, 1982
1.309
+0.747
133.18%
jan 1, 1983
1.309
0.0
0.0%
jan 1, 1984
1.309
+0.0
0.0%
jan 1, 1985
1.309
0.0
0.0%
jan 1, 1986
1.309
0.0
0.0%
jan 1, 1987
1.309
+0.0
0.0%
jan 1, 1988
1.309
0.0
0.0%
jan 1, 1989
1.309
+0.0
0.0%
jan 1, 1990
1.309
0.0
0.0%
jan 1, 1991
0.322
-0.987
-75.43%
jan 1, 1992
0.035
-0.287
-89.23%
jan 1, 1993
0.006
-0.029
-84.04%
jan 1, 1994
0.246
+0.241
4.35K%
jan 1, 1995
0.282
+0.036
14.69%
jan 1, 1996
0.044
-0.238
-84.46%
jan 1, 1997
0.156
+0.112
256.16%
jan 1, 1998
0.455
+0.299
191.51%
jan 1, 1999
0.087
-0.369
-80.97%
jan 1, 2000
0.085
-0.001
-1.52%
jan 1, 2001
0.174
+0.089
104.26%
jan 1, 2002
0.1
-0.074
-42.44%
jan 1, 2003
0.157
+0.057
56.48%
jan 1, 2004
0.11
-0.047
-29.75%
jan 1, 2005
0.135
+0.024
22.11%
jan 1, 2006
0.176
+0.042
31.1%
jan 1, 2007
0.217
+0.041
23.09%
jan 1, 2008
0.171
-0.047
-21.48%
jan 1, 2009
0.248
+0.078
45.57%
jan 1, 2010
0.26
+0.012
4.74%
jan 1, 2011
0.139
-0.121
-46.63%
jan 1, 2012
0.157
+0.018
13.0%
jan 1, 2013
0.33
+0.173
110.26%
jan 1, 2014
0.218
-0.112
-33.81%
jan 1, 2015
0.158
-0.06
-27.43%
Ranking of countries by current statistics by years


Comments: