29
/
en
AIzaSyAYiBZKx7MnpbEhh9jyipgxe19OcubqV5w
April 1, 2024
282570
Vietnam
VNM
true
2
1
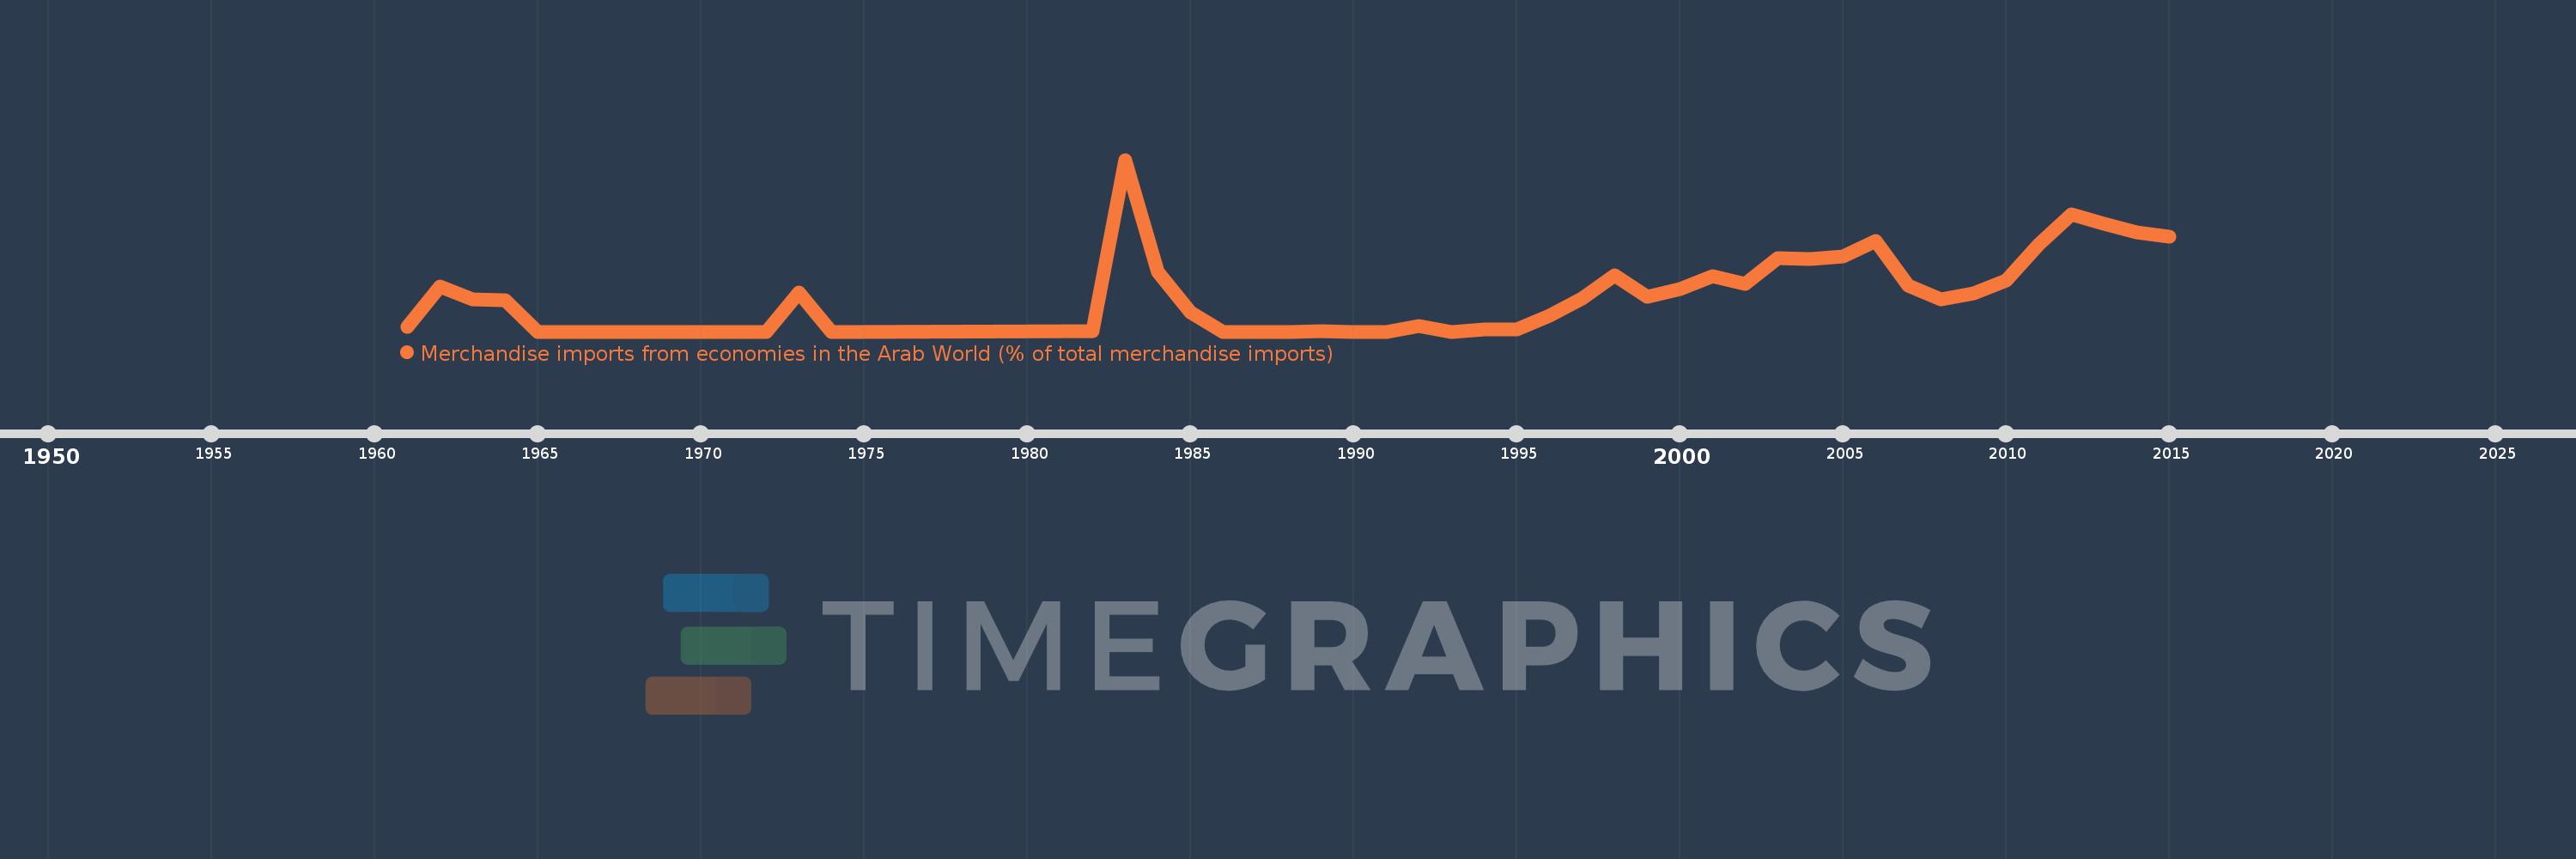
Merchandise imports from economies in the Arab World (% of total merchandise imports)
2015,2014,2013,2012,2011,2010,2009,2008,2007,2006,2005,2004,2003,2002,2001,2000,1999,1998,1997,1996,1995,1994,1993,1992,1991,1990,1989,1988,1987,1986,1985,1984,1983,1982,1974,1973,1972,1971,1970,1969,1968,1967,1966,1965,1964,1963,1962,1961
This statistics in other country:
AfghanistanAlbaniaAlgeriaAngolaArab WorldArgentinaArmeniaArubaAustraliaAustriaAzerbaijanBahamas, TheBahrainBangladeshBarbadosBelarusBelgiumBelizeBeninBermudaBoliviaBrazilBrunei DarussalamBulgariaBurkina FasoBurundiCabo VerdeCambodiaCameroonCanadaCaribbean small statesCentral African RepublicCentral Europe and the BalticsChadChileChinaColombiaComorosCongo, Dem. Rep.Congo, Rep.Costa RicaCote d'IvoireCroatiaCubaCyprusCzech RepublicDenmarkDjiboutiDominicaDominican RepublicEarly-demographic dividendEast Asia & PacificEast Asia & Pacific (excluding high income)East Asia & Pacific (IDA & IBRD countries)EcuadorEgypt, Arab Rep.El SalvadorEstoniaEthiopiaEuro areaEurope & Central AsiaEurope & Central Asia (excluding high income)Europe & Central Asia (IDA & IBRD countries)European UnionFijiFinlandFragile and conflict affected situationsFranceFrench PolynesiaGabonGambia, TheGeorgiaGermanyGhanaGreeceGreenlandGrenadaGuatemalaGuineaGuinea-BissauGuyanaHaitiHeavily indebted poor countries (HIPC)High incomeHondurasHong Kong SAR, ChinaHungaryIBRD onlyIcelandIDA & IBRD totalIDA blendIDA onlyIDA totalIndiaIndonesiaIran, Islamic Rep.IraqIrelandItalyJamaicaJapanJordanKazakhstanKenyaKorea, Dem. People’s Rep.Korea, Rep.KuwaitKyrgyz RepublicLao PDRLate-demographic dividendLatin America & Caribbean Latin America & Caribbean (excluding high income)Latin America & the Caribbean (IDA & IBRD countries)LatviaLeast developed countries: UN classificationLebanonLiberiaLibyaLithuaniaLow & middle incomeLow incomeLower middle incomeLuxembourgMacao SAR, ChinaMacedonia, FYRMadagascarMalawiMalaysiaMaldivesMaliMaltaMauritaniaMauritiusMexicoMiddle East & North AfricaMiddle East & North Africa (excluding high income)Middle East & North Africa (IDA & IBRD countries)Middle incomeMoldovaMongoliaMontenegroMoroccoMozambiqueMyanmarNepalNetherlandsNew CaledoniaNew ZealandNicaraguaNigerNigeriaNorth AmericaNorwayOECD membersOmanOther small statesPacific island small statesPakistanPanamaPapua New GuineaParaguayPeruPhilippinesPolandPortugalPost-demographic dividendPre-demographic dividendQatarRomaniaRussian FederationRwandaSaudi ArabiaSenegalSerbiaSeychellesSierra LeoneSingaporeSlovak RepublicSloveniaSmall statesSomaliaSouth AfricaSouth AsiaSouth Asia (IDA & IBRD)SpainSri LankaSt. LuciaSt. Vincent and the GrenadinesSub-Saharan Africa Sub-Saharan Africa (excluding high income)Sub-Saharan Africa (IDA & IBRD countries)SudanSurinameSwedenSwitzerlandSyrian Arab RepublicTajikistanTanzaniaThailandTogoTrinidad and TobagoTunisiaTurkeyTurkmenistanUgandaUkraineUnited Arab EmiratesUnited KingdomUnited StatesUpper middle incomeUruguayVenezuela, RBVietnamWorldYemen, Rep.ZambiaZimbabwe Timeline:
This timeline shows a graph from 1961 to 2015 of Vietnam. No data until 1960. Number of actual observations by date: 48.
Source name:
World Development Indicators
Source organization:
World Bank staff estimates based data from International Monetary Fund's Direction of Trade database.
Categories, topics:
Private Sector, Trade
Last updated:
apr 23, 2017
Indicators value changes by year
At the date of observation
Value
Absolute change
Change from previous value
jan 1, 1961
0.083
+0.083
0.0%
jan 1, 1962
0.791
+0.707
847.41%
jan 1, 1963
0.569
-0.222
-28.07%
jan 1, 1964
0.557
-0.012
-2.1%
jan 1, 1965
0.0
-0.557
-100.0%
jan 1, 1973
0.695
+0.695
%
jan 1, 1974
0.0
-0.695
-100.0%
jan 1, 1982
0.006
+0.006
%
jan 1, 1983
3.037
+3.031
51.95K%
jan 1, 1984
1.057
-1.98
-65.2%
jan 1, 1985
0.335
-0.721
-68.27%
jan 1, 1986
0.0
-0.335
-100.0%
jan 1, 1989
0.009
+0.009
%
jan 1, 1990
0.0
-0.009
-100.0%
jan 1, 1993
0.0
-0.1
-99.83%
jan 1, 1994
0.044
+0.044
26.76K%
jan 1, 1995
0.035
-0.009
-20.65%
jan 1, 1996
0.283
+0.248
704.27%
jan 1, 1997
0.588
+0.305
107.7%
jan 1, 1998
1.0
+0.412
70.1%
jan 1, 1999
0.615
-0.386
-38.54%
jan 1, 2000
0.747
+0.132
21.54%
jan 1, 2001
0.98
+0.233
31.15%
jan 1, 2002
0.848
-0.132
-13.49%
jan 1, 2003
1.295
+0.447
52.74%
jan 1, 2004
1.28
-0.015
-1.14%
jan 1, 2005
1.324
+0.044
3.4%
jan 1, 2006
1.595
+0.272
20.52%
jan 1, 2007
0.807
-0.789
-49.43%
jan 1, 2008
0.565
-0.242
-29.94%
jan 1, 2009
0.682
+0.117
20.7%
jan 1, 2010
0.906
+0.224
32.8%
jan 1, 2011
1.543
+0.637
70.25%
jan 1, 2012
2.066
+0.523
33.89%
jan 1, 2013
1.91
-0.155
-7.52%
jan 1, 2014
1.76
-0.15
-7.87%
jan 1, 2015
1.675
-0.085
-4.84%
Ranking of countries by current statistics by years


Comments: