29
/
en
AIzaSyAYiBZKx7MnpbEhh9jyipgxe19OcubqV5w
April 1, 2024
77365
Bahrain
BHR
true
2
1
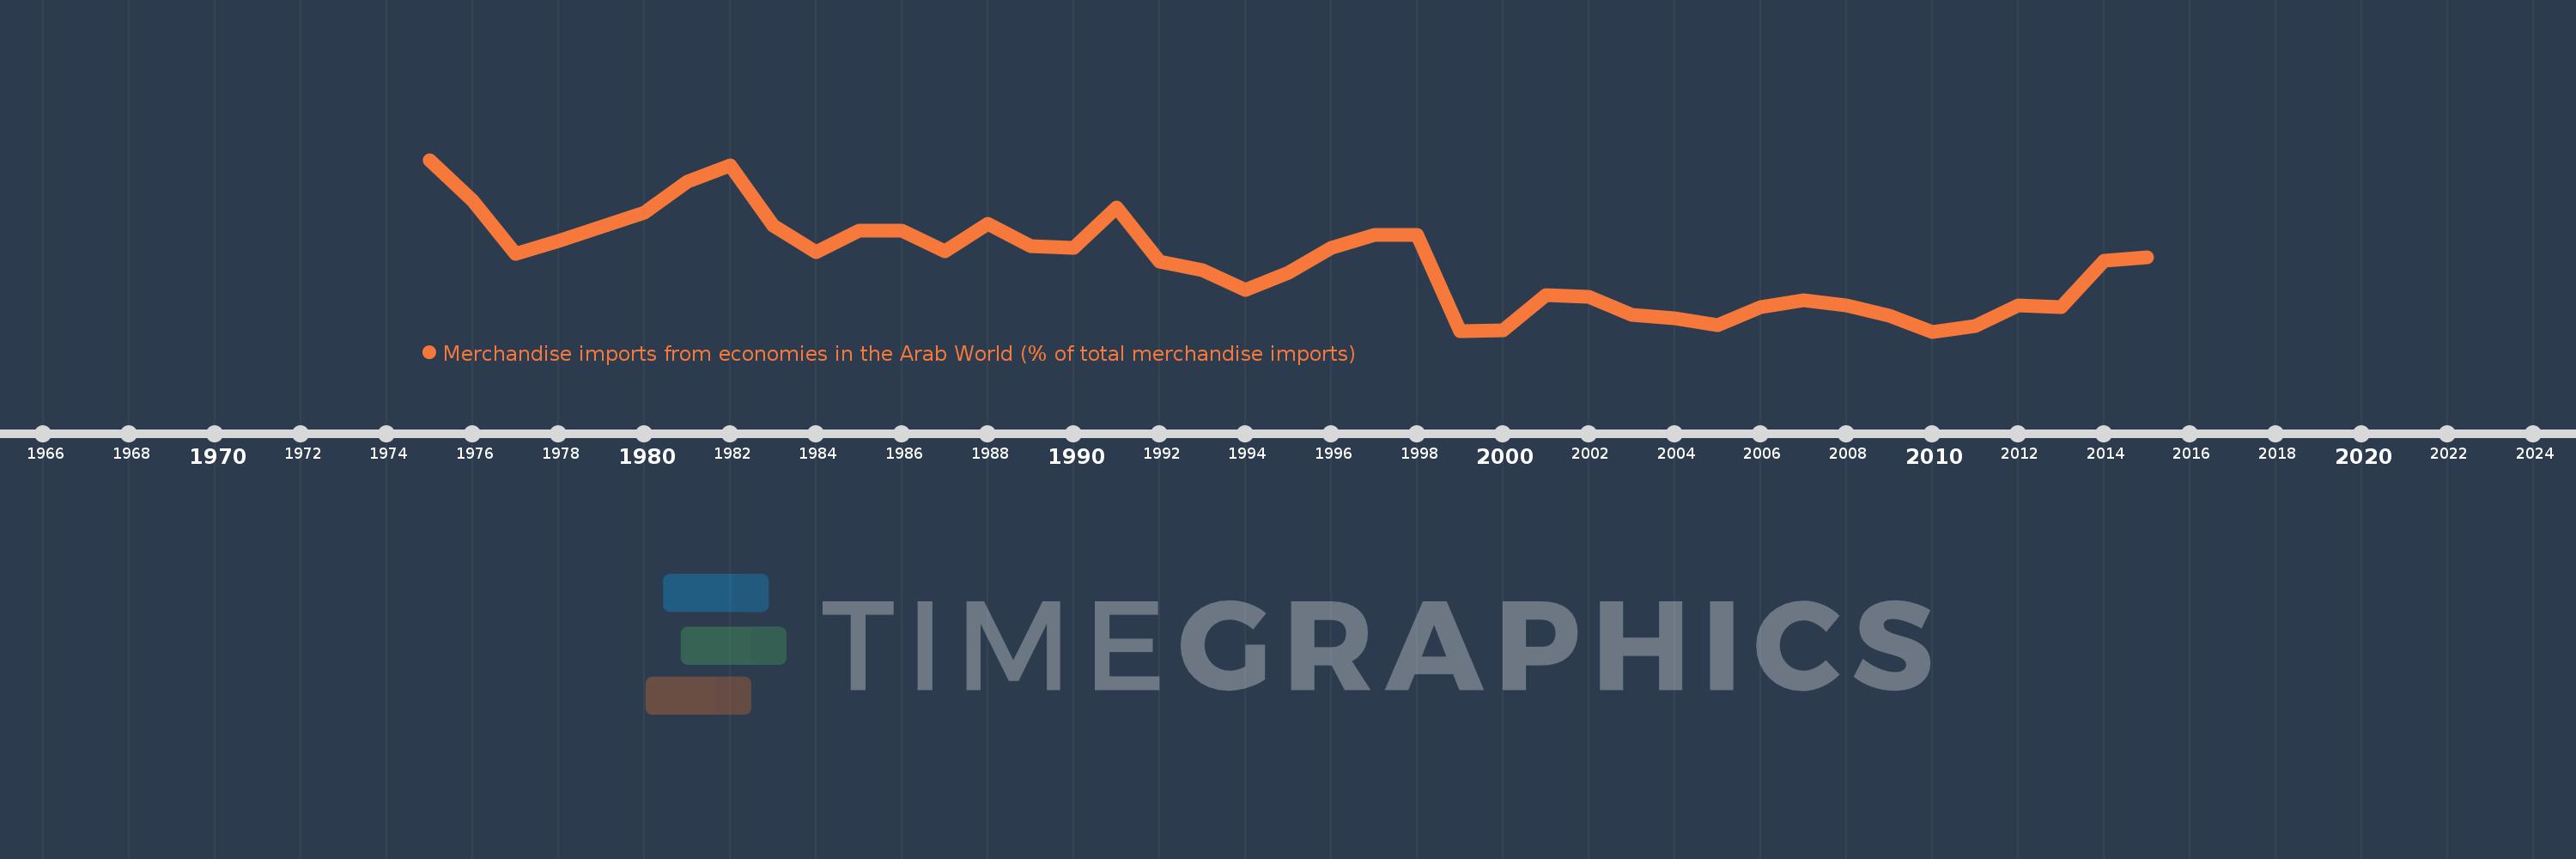
Merchandise imports from economies in the Arab World (% of total merchandise imports)
2015,2014,2013,2012,2011,2010,2009,2008,2007,2006,2005,2004,2003,2002,2001,2000,1999,1998,1997,1996,1995,1994,1993,1992,1991,1990,1989,1988,1987,1986,1985,1984,1983,1982,1981,1980,1978,1977,1976,1975
This statistics in other country:
AfghanistanAlbaniaAlgeriaAngolaArab WorldArgentinaArmeniaArubaAustraliaAustriaAzerbaijanBahamas, TheBahrainBangladeshBarbadosBelarusBelgiumBelizeBeninBermudaBoliviaBrazilBrunei DarussalamBulgariaBurkina FasoBurundiCabo VerdeCambodiaCameroonCanadaCaribbean small statesCentral African RepublicCentral Europe and the BalticsChadChileChinaColombiaComorosCongo, Dem. Rep.Congo, Rep.Costa RicaCote d'IvoireCroatiaCubaCyprusCzech RepublicDenmarkDjiboutiDominicaDominican RepublicEarly-demographic dividendEast Asia & PacificEast Asia & Pacific (excluding high income)East Asia & Pacific (IDA & IBRD countries)EcuadorEgypt, Arab Rep.El SalvadorEstoniaEthiopiaEuro areaEurope & Central AsiaEurope & Central Asia (excluding high income)Europe & Central Asia (IDA & IBRD countries)European UnionFijiFinlandFragile and conflict affected situationsFranceFrench PolynesiaGabonGambia, TheGeorgiaGermanyGhanaGreeceGreenlandGrenadaGuatemalaGuineaGuinea-BissauGuyanaHaitiHeavily indebted poor countries (HIPC)High incomeHondurasHong Kong SAR, ChinaHungaryIBRD onlyIcelandIDA & IBRD totalIDA blendIDA onlyIDA totalIndiaIndonesiaIran, Islamic Rep.IraqIrelandItalyJamaicaJapanJordanKazakhstanKenyaKorea, Dem. People’s Rep.Korea, Rep.KuwaitKyrgyz RepublicLao PDRLate-demographic dividendLatin America & Caribbean Latin America & Caribbean (excluding high income)Latin America & the Caribbean (IDA & IBRD countries)LatviaLeast developed countries: UN classificationLebanonLiberiaLibyaLithuaniaLow & middle incomeLow incomeLower middle incomeLuxembourgMacao SAR, ChinaMacedonia, FYRMadagascarMalawiMalaysiaMaldivesMaliMaltaMauritaniaMauritiusMexicoMiddle East & North AfricaMiddle East & North Africa (excluding high income)Middle East & North Africa (IDA & IBRD countries)Middle incomeMoldovaMongoliaMontenegroMoroccoMozambiqueMyanmarNepalNetherlandsNew CaledoniaNew ZealandNicaraguaNigerNigeriaNorth AmericaNorwayOECD membersOmanOther small statesPacific island small statesPakistanPanamaPapua New GuineaParaguayPeruPhilippinesPolandPortugalPost-demographic dividendPre-demographic dividendQatarRomaniaRussian FederationRwandaSaudi ArabiaSenegalSerbiaSeychellesSierra LeoneSingaporeSlovak RepublicSloveniaSmall statesSomaliaSouth AfricaSouth AsiaSouth Asia (IDA & IBRD)SpainSri LankaSt. LuciaSt. Vincent and the GrenadinesSub-Saharan Africa Sub-Saharan Africa (excluding high income)Sub-Saharan Africa (IDA & IBRD countries)SudanSurinameSwedenSwitzerlandSyrian Arab RepublicTajikistanTanzaniaThailandTogoTrinidad and TobagoTunisiaTurkeyTurkmenistanUgandaUkraineUnited Arab EmiratesUnited KingdomUnited StatesUpper middle incomeUruguayVenezuela, RBVietnamWorldYemen, Rep.ZambiaZimbabwe Timeline:
This timeline shows a graph from 1975 to 2015 of Bahrain. No data until 1974. Number of actual observations by date: 40.
Source name:
World Development Indicators
Source organization:
World Bank staff estimates based data from International Monetary Fund's Direction of Trade database.
Categories, topics:
Private Sector, Trade
Last updated:
apr 23, 2017
Indicators value changes by year
Minimum:
29.301
jan 1, 2010
Maximum:
62.487
jan 1, 1975
At the date of observation
Value
Absolute change
Change from previous value
jan 1, 1975
62.487
+62.487
0.0%
jan 1, 1976
54.569
-7.918
-12.67%
jan 1, 1977
44.361
-10.208
-18.71%
jan 1, 1978
46.85
+2.489
5.61%
jan 1, 1980
52.207
+5.357
11.43%
jan 1, 1981
58.313
+6.106
11.69%
jan 1, 1982
61.37
+3.057
5.24%
jan 1, 1983
49.725
-11.644
-18.97%
jan 1, 1984
44.657
-5.068
-10.19%
jan 1, 1985
48.781
+4.123
9.23%
jan 1, 1986
48.781
+0.0
0.0%
jan 1, 1987
44.734
-4.047
-8.3%
jan 1, 1988
50.156
+5.422
12.12%
jan 1, 1989
45.881
-4.275
-8.52%
jan 1, 1990
45.472
-0.409
-0.89%
jan 1, 1991
53.317
+7.845
17.25%
jan 1, 1992
42.858
-10.459
-19.62%
jan 1, 1993
41.148
-1.71
-3.99%
jan 1, 1994
37.274
-3.874
-9.41%
jan 1, 1995
40.593
+3.319
8.9%
jan 1, 1996
45.532
+4.939
12.17%
jan 1, 1997
47.891
+2.36
5.18%
jan 1, 1998
47.966
+0.075
0.16%
jan 1, 1999
29.337
-18.629
-38.84%
jan 1, 2000
29.518
+0.182
0.62%
jan 1, 2001
36.273
+6.755
22.88%
jan 1, 2002
36.099
-0.174
-0.48%
jan 1, 2003
32.529
-3.57
-9.89%
jan 1, 2004
31.917
-0.613
-1.88%
jan 1, 2005
30.466
-1.451
-4.54%
jan 1, 2006
34.061
+3.595
11.8%
jan 1, 2007
35.297
+1.236
3.63%
jan 1, 2008
34.38
-0.917
-2.6%
jan 1, 2009
32.336
-2.044
-5.94%
jan 1, 2010
29.301
-3.035
-9.39%
jan 1, 2011
30.39
+1.089
3.72%
jan 1, 2012
34.345
+3.955
13.01%
jan 1, 2013
34.016
-0.328
-0.96%
jan 1, 2014
42.922
+8.906
26.18%
jan 1, 2015
43.581
+0.659
1.53%
Ranking of countries by current statistics by years


Comments: