29
/
en
AIzaSyAYiBZKx7MnpbEhh9jyipgxe19OcubqV5w
April 1, 2024
47354
Lower middle income
LMC
false
2
1
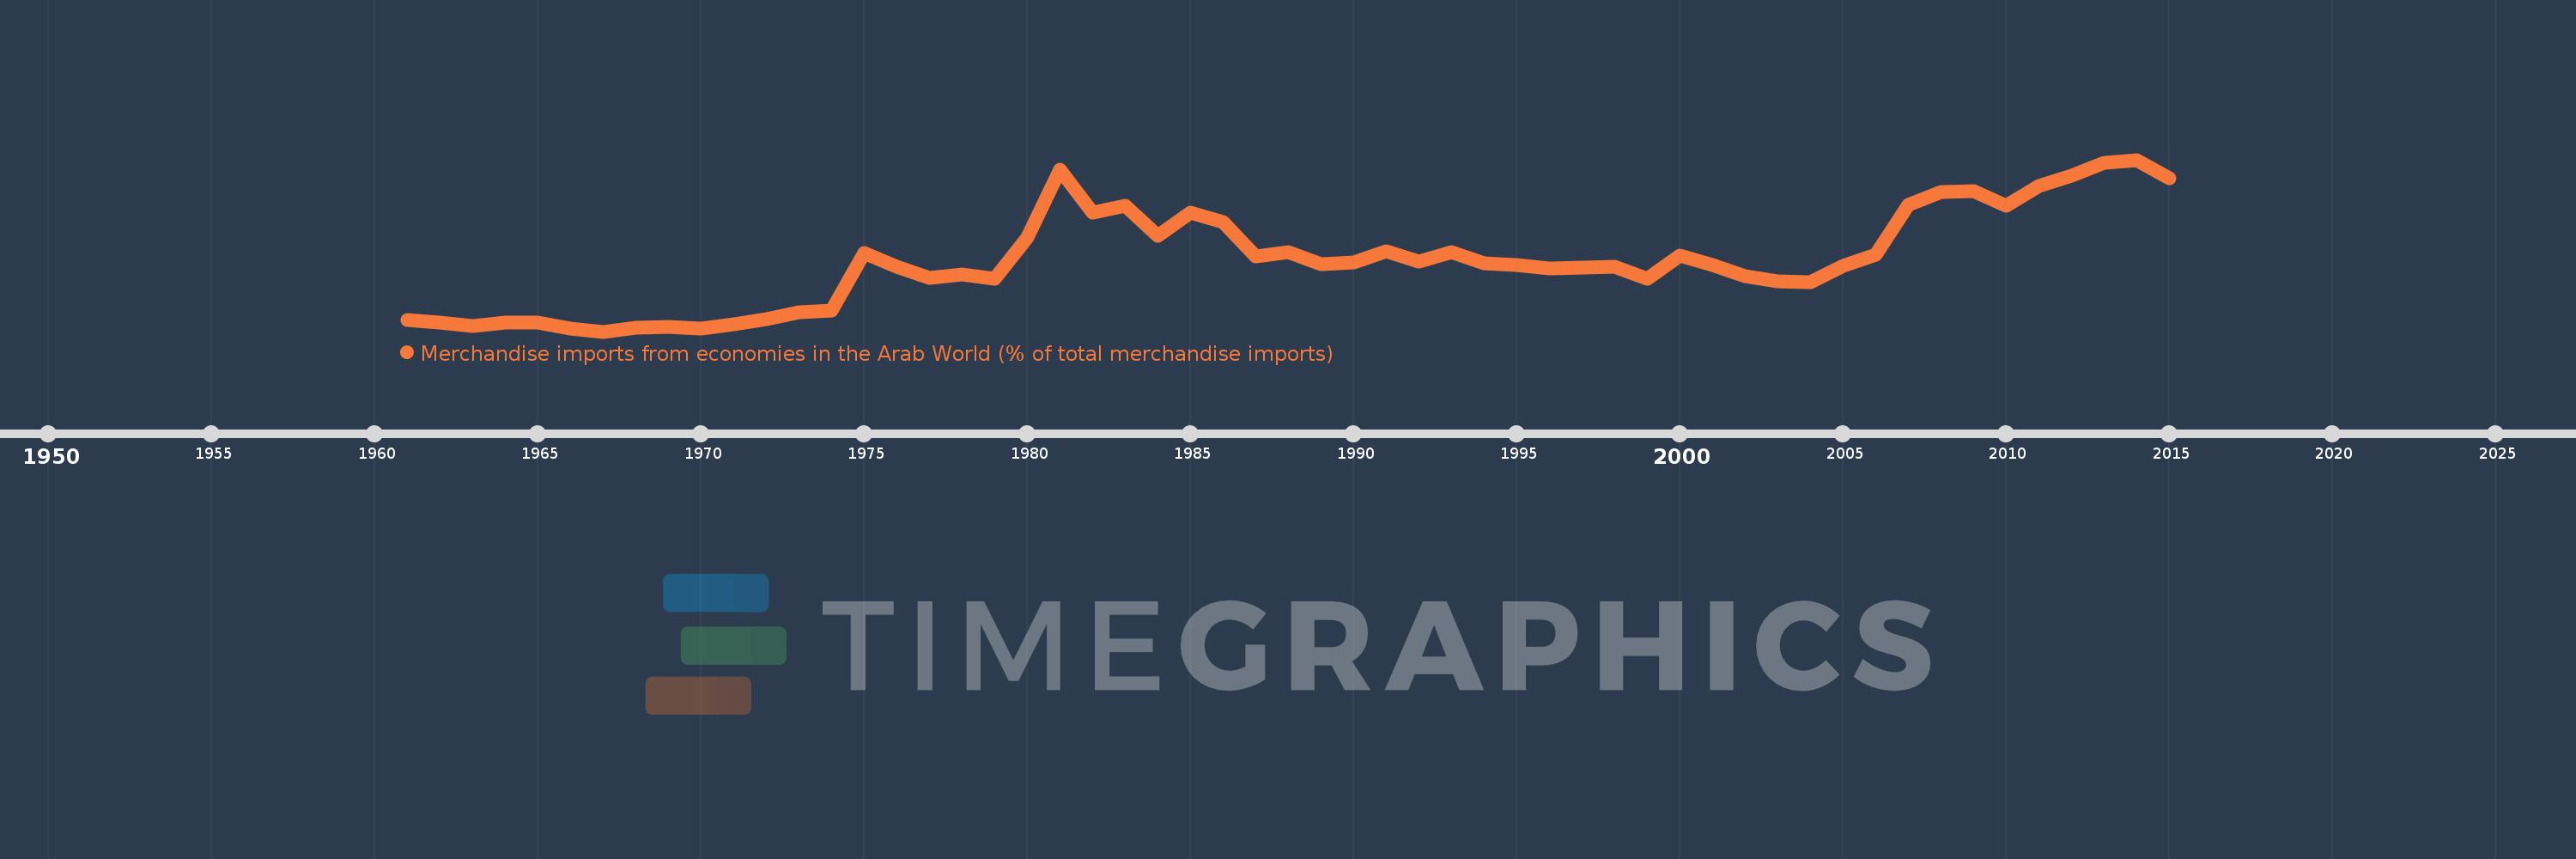
Merchandise imports from economies in the Arab World (% of total merchandise imports)
2015,2014,2013,2012,2011,2010,2009,2008,2007,2006,2005,2004,2003,2002,2001,2000,1999,1998,1997,1996,1995,1994,1993,1992,1991,1990,1989,1988,1987,1986,1985,1984,1983,1982,1981,1980,1979,1978,1977,1976,1975,1974,1973,1972,1971,1970,1969,1968,1967,1966,1965,1964,1963,1962,1961
This statistics in other country:
AfghanistanAlbaniaAlgeriaAngolaArab WorldArgentinaArmeniaArubaAustraliaAustriaAzerbaijanBahamas, TheBahrainBangladeshBarbadosBelarusBelgiumBelizeBeninBermudaBoliviaBrazilBrunei DarussalamBulgariaBurkina FasoBurundiCabo VerdeCambodiaCameroonCanadaCaribbean small statesCentral African RepublicCentral Europe and the BalticsChadChileChinaColombiaComorosCongo, Dem. Rep.Congo, Rep.Costa RicaCote d'IvoireCroatiaCubaCyprusCzech RepublicDenmarkDjiboutiDominicaDominican RepublicEarly-demographic dividendEast Asia & PacificEast Asia & Pacific (excluding high income)East Asia & Pacific (IDA & IBRD countries)EcuadorEgypt, Arab Rep.El SalvadorEstoniaEthiopiaEuro areaEurope & Central AsiaEurope & Central Asia (excluding high income)Europe & Central Asia (IDA & IBRD countries)European UnionFijiFinlandFragile and conflict affected situationsFranceFrench PolynesiaGabonGambia, TheGeorgiaGermanyGhanaGreeceGreenlandGrenadaGuatemalaGuineaGuinea-BissauGuyanaHaitiHeavily indebted poor countries (HIPC)High incomeHondurasHong Kong SAR, ChinaHungaryIBRD onlyIcelandIDA & IBRD totalIDA blendIDA onlyIDA totalIndiaIndonesiaIran, Islamic Rep.IraqIrelandItalyJamaicaJapanJordanKazakhstanKenyaKorea, Dem. People’s Rep.Korea, Rep.KuwaitKyrgyz RepublicLao PDRLate-demographic dividendLatin America & Caribbean Latin America & Caribbean (excluding high income)Latin America & the Caribbean (IDA & IBRD countries)LatviaLeast developed countries: UN classificationLebanonLiberiaLibyaLithuaniaLow & middle incomeLow incomeLower middle incomeLuxembourgMacao SAR, ChinaMacedonia, FYRMadagascarMalawiMalaysiaMaldivesMaliMaltaMauritaniaMauritiusMexicoMiddle East & North AfricaMiddle East & North Africa (excluding high income)Middle East & North Africa (IDA & IBRD countries)Middle incomeMoldovaMongoliaMontenegroMoroccoMozambiqueMyanmarNepalNetherlandsNew CaledoniaNew ZealandNicaraguaNigerNigeriaNorth AmericaNorwayOECD membersOmanOther small statesPacific island small statesPakistanPanamaPapua New GuineaParaguayPeruPhilippinesPolandPortugalPost-demographic dividendPre-demographic dividendQatarRomaniaRussian FederationRwandaSaudi ArabiaSenegalSerbiaSeychellesSierra LeoneSingaporeSlovak RepublicSloveniaSmall statesSomaliaSouth AfricaSouth AsiaSouth Asia (IDA & IBRD)SpainSri LankaSt. LuciaSt. Vincent and the GrenadinesSub-Saharan Africa Sub-Saharan Africa (excluding high income)Sub-Saharan Africa (IDA & IBRD countries)SudanSurinameSwedenSwitzerlandSyrian Arab RepublicTajikistanTanzaniaThailandTogoTrinidad and TobagoTunisiaTurkeyTurkmenistanUgandaUkraineUnited Arab EmiratesUnited KingdomUnited StatesUpper middle incomeUruguayVenezuela, RBVietnamWorldYemen, Rep.ZambiaZimbabwe Timeline:
This timeline shows a graph from 1961 to 2015 of Lower middle income. No data until 1960. Number of actual observations by date: 55.
Source name:
World Development Indicators
Source organization:
World Bank staff estimates based data from International Monetary Fund's Direction of Trade database.
Categories, topics:
Private Sector, Trade
Last updated:
apr 23, 2017
Indicators value changes by year
Maximum:
15.377
jan 1, 2014
At the date of observation
Value
Absolute change
Change from previous value
jan 1, 1961
3.428
+3.428
0.0%
jan 1, 1962
3.206
-0.222
-6.46%
jan 1, 1963
2.974
-0.232
-7.25%
jan 1, 1964
3.231
+0.257
8.65%
jan 1, 1965
3.219
-0.012
-0.38%
jan 1, 1966
2.727
-0.492
-15.3%
jan 1, 1967
2.529
-0.197
-7.24%
jan 1, 1968
2.818
+0.289
11.44%
jan 1, 1969
2.902
+0.083
2.96%
jan 1, 1970
2.775
-0.127
-4.39%
jan 1, 1971
3.052
+0.277
9.99%
jan 1, 1972
3.44
+0.388
12.71%
jan 1, 1973
3.961
+0.522
15.16%
jan 1, 1974
4.098
+0.137
3.46%
jan 1, 1975
8.399
+4.301
104.94%
jan 1, 1976
7.363
-1.036
-12.33%
jan 1, 1977
6.555
-0.808
-10.97%
jan 1, 1978
6.792
+0.236
3.61%
jan 1, 1979
6.509
-0.283
-4.16%
jan 1, 1980
9.549
+3.04
46.7%
jan 1, 1981
14.656
+5.107
53.49%
jan 1, 1982
11.455
-3.202
-21.84%
jan 1, 1983
11.948
+0.493
4.31%
jan 1, 1984
9.704
-2.244
-18.78%
jan 1, 1985
11.421
+1.717
17.69%
jan 1, 1986
10.708
-0.714
-6.25%
jan 1, 1987
8.145
-2.563
-23.93%
jan 1, 1988
8.455
+0.31
3.81%
jan 1, 1989
7.552
-0.903
-10.68%
jan 1, 1990
7.681
+0.129
1.7%
jan 1, 1991
8.515
+0.834
10.86%
jan 1, 1992
7.768
-0.747
-8.78%
jan 1, 1993
8.495
+0.728
9.37%
jan 1, 1994
7.639
-0.856
-10.08%
jan 1, 1995
7.494
-0.145
-1.9%
jan 1, 1996
7.247
-0.246
-3.29%
jan 1, 1997
7.341
+0.094
1.3%
jan 1, 1998
7.401
+0.06
0.81%
jan 1, 1999
6.479
-0.922
-12.46%
jan 1, 2000
8.183
+1.704
26.29%
jan 1, 2001
7.496
-0.687
-8.39%
jan 1, 2002
6.664
-0.832
-11.09%
jan 1, 2003
6.316
-0.349
-5.23%
jan 1, 2004
6.221
-0.095
-1.5%
jan 1, 2005
7.462
+1.241
19.96%
jan 1, 2006
8.266
+0.804
10.77%
jan 1, 2007
11.997
+3.731
45.14%
jan 1, 2008
12.994
+0.996
8.31%
jan 1, 2009
13.052
+0.059
0.45%
jan 1, 2010
11.948
-1.104
-8.46%
jan 1, 2011
13.425
+1.477
12.36%
jan 1, 2012
14.206
+0.781
5.82%
jan 1, 2013
15.124
+0.918
6.46%
jan 1, 2014
15.377
+0.253
1.68%
jan 1, 2015
14.017
-1.36
-8.84%
Ranking of countries by current statistics by years


Comments: