29
/
en
AIzaSyAYiBZKx7MnpbEhh9jyipgxe19OcubqV5w
April 1, 2024
277950
Uruguay
URY
true
2
1
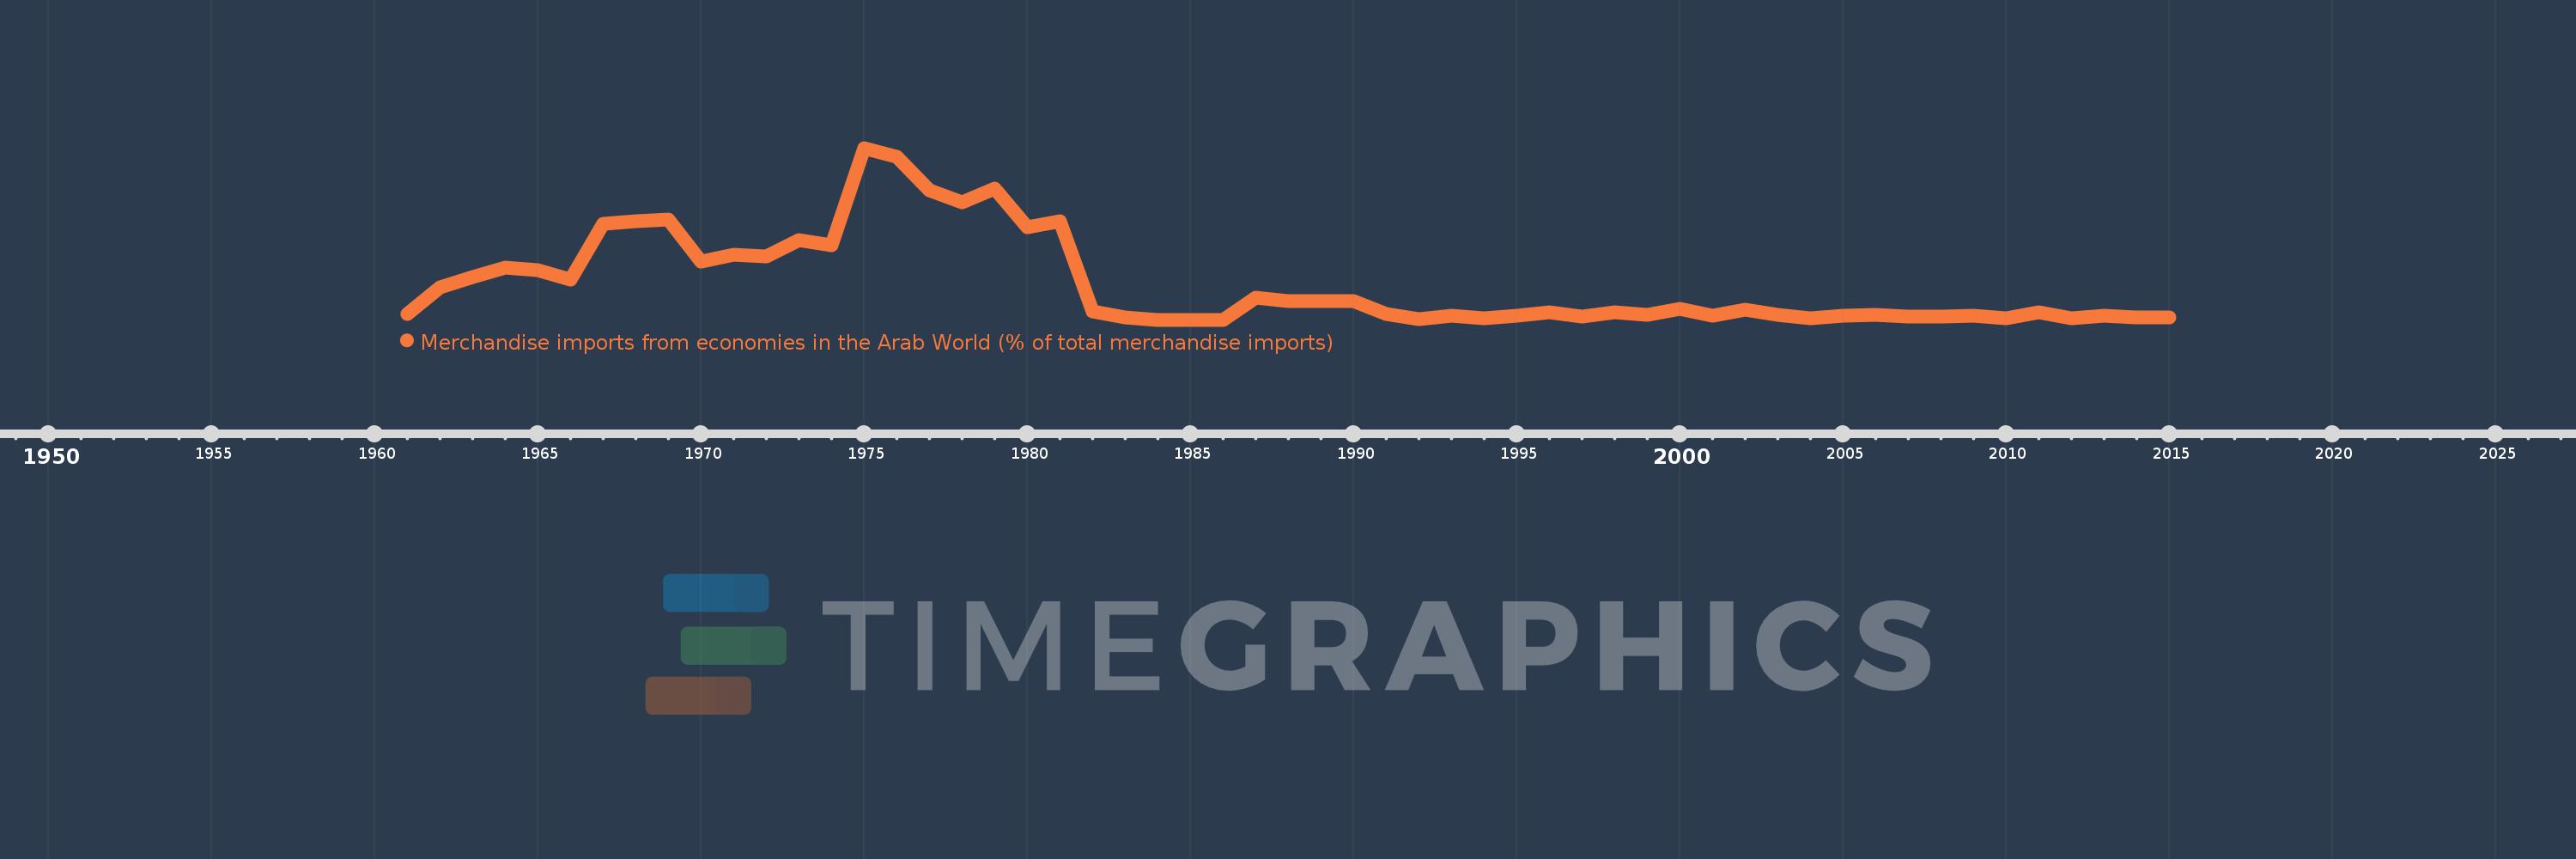
Merchandise imports from economies in the Arab World (% of total merchandise imports)
2015,2014,2013,2012,2011,2010,2009,2008,2007,2006,2005,2004,2003,2002,2001,2000,1999,1998,1997,1996,1995,1994,1993,1992,1991,1990,1989,1988,1987,1986,1985,1984,1983,1982,1981,1980,1979,1978,1977,1976,1975,1974,1973,1972,1971,1970,1969,1968,1967,1966,1965,1964,1963,1962,1961
This statistics in other country:
AfghanistanAlbaniaAlgeriaAngolaArab WorldArgentinaArmeniaArubaAustraliaAustriaAzerbaijanBahamas, TheBahrainBangladeshBarbadosBelarusBelgiumBelizeBeninBermudaBoliviaBrazilBrunei DarussalamBulgariaBurkina FasoBurundiCabo VerdeCambodiaCameroonCanadaCaribbean small statesCentral African RepublicCentral Europe and the BalticsChadChileChinaColombiaComorosCongo, Dem. Rep.Congo, Rep.Costa RicaCote d'IvoireCroatiaCubaCyprusCzech RepublicDenmarkDjiboutiDominicaDominican RepublicEarly-demographic dividendEast Asia & PacificEast Asia & Pacific (excluding high income)East Asia & Pacific (IDA & IBRD countries)EcuadorEgypt, Arab Rep.El SalvadorEstoniaEthiopiaEuro areaEurope & Central AsiaEurope & Central Asia (excluding high income)Europe & Central Asia (IDA & IBRD countries)European UnionFijiFinlandFragile and conflict affected situationsFranceFrench PolynesiaGabonGambia, TheGeorgiaGermanyGhanaGreeceGreenlandGrenadaGuatemalaGuineaGuinea-BissauGuyanaHaitiHeavily indebted poor countries (HIPC)High incomeHondurasHong Kong SAR, ChinaHungaryIBRD onlyIcelandIDA & IBRD totalIDA blendIDA onlyIDA totalIndiaIndonesiaIran, Islamic Rep.IraqIrelandItalyJamaicaJapanJordanKazakhstanKenyaKorea, Dem. People’s Rep.Korea, Rep.KuwaitKyrgyz RepublicLao PDRLate-demographic dividendLatin America & Caribbean Latin America & Caribbean (excluding high income)Latin America & the Caribbean (IDA & IBRD countries)LatviaLeast developed countries: UN classificationLebanonLiberiaLibyaLithuaniaLow & middle incomeLow incomeLower middle incomeLuxembourgMacao SAR, ChinaMacedonia, FYRMadagascarMalawiMalaysiaMaldivesMaliMaltaMauritaniaMauritiusMexicoMiddle East & North AfricaMiddle East & North Africa (excluding high income)Middle East & North Africa (IDA & IBRD countries)Middle incomeMoldovaMongoliaMontenegroMoroccoMozambiqueMyanmarNepalNetherlandsNew CaledoniaNew ZealandNicaraguaNigerNigeriaNorth AmericaNorwayOECD membersOmanOther small statesPacific island small statesPakistanPanamaPapua New GuineaParaguayPeruPhilippinesPolandPortugalPost-demographic dividendPre-demographic dividendQatarRomaniaRussian FederationRwandaSaudi ArabiaSenegalSerbiaSeychellesSierra LeoneSingaporeSlovak RepublicSloveniaSmall statesSomaliaSouth AfricaSouth AsiaSouth Asia (IDA & IBRD)SpainSri LankaSt. LuciaSt. Vincent and the GrenadinesSub-Saharan Africa Sub-Saharan Africa (excluding high income)Sub-Saharan Africa (IDA & IBRD countries)SudanSurinameSwedenSwitzerlandSyrian Arab RepublicTajikistanTanzaniaThailandTogoTrinidad and TobagoTunisiaTurkeyTurkmenistanUgandaUkraineUnited Arab EmiratesUnited KingdomUnited StatesUpper middle incomeUruguayVenezuela, RBVietnamWorldYemen, Rep.ZambiaZimbabwe Timeline:
This timeline shows a graph from 1961 to 2015 of Uruguay. No data until 1960. Number of actual observations by date: 55.
Source name:
World Development Indicators
Source organization:
World Bank staff estimates based data from International Monetary Fund's Direction of Trade database.
Categories, topics:
Private Sector, Trade
Last updated:
apr 23, 2017
Indicators value changes by year
Maximum:
22.603
jan 1, 1975
At the date of observation
Value
Absolute change
Change from previous value
jan 1, 1961
0.795
+0.795
0.0%
jan 1, 1962
4.321
+3.526
443.72%
jan 1, 1963
5.609
+1.288
29.81%
jan 1, 1964
6.84
+1.231
21.95%
jan 1, 1965
6.494
-0.346
-5.06%
jan 1, 1966
5.27
-1.224
-18.85%
jan 1, 1967
12.674
+7.404
140.49%
jan 1, 1968
13.031
+0.356
2.81%
jan 1, 1969
13.204
+0.173
1.33%
jan 1, 1970
7.634
-5.57
-42.19%
jan 1, 1971
8.54
+0.906
11.87%
jan 1, 1972
8.328
-0.212
-2.48%
jan 1, 1973
10.471
+2.143
25.73%
jan 1, 1974
9.82
-0.651
-6.22%
jan 1, 1975
22.603
+12.783
130.17%
jan 1, 1976
21.451
-1.152
-5.1%
jan 1, 1977
17.012
-4.439
-20.7%
jan 1, 1978
15.436
-1.576
-9.27%
jan 1, 1979
17.305
+1.869
12.11%
jan 1, 1980
12.181
-5.124
-29.61%
jan 1, 1981
12.934
+0.753
6.18%
jan 1, 1982
1.133
-11.8
-91.24%
jan 1, 1983
0.374
-0.759
-66.98%
jan 1, 1984
0.029
-0.346
-92.38%
jan 1, 1985
0.03
+0.001
3.71%
jan 1, 1986
0.047
+0.018
60.54%
jan 1, 1987
2.898
+2.851
6.0K%
jan 1, 1988
2.478
-0.42
-14.5%
jan 1, 1989
2.475
-0.003
-0.11%
jan 1, 1990
2.458
-0.017
-0.69%
jan 1, 1991
0.827
-1.631
-66.34%
jan 1, 1992
0.116
-0.712
-86.01%
jan 1, 1993
0.572
+0.456
394.12%
jan 1, 1994
0.232
-0.34
-59.51%
jan 1, 1995
0.539
+0.308
132.76%
jan 1, 1996
1.013
+0.474
87.88%
jan 1, 1997
0.42
-0.593
-58.52%
jan 1, 1998
1.012
+0.592
140.88%
jan 1, 1999
0.677
-0.335
-33.07%
jan 1, 2000
1.478
+0.8
118.17%
jan 1, 2001
0.557
-0.921
-62.32%
jan 1, 2002
1.332
+0.776
139.28%
jan 1, 2003
0.627
-0.705
-52.93%
jan 1, 2004
0.198
-0.429
-68.38%
jan 1, 2005
0.562
+0.364
183.34%
jan 1, 2006
0.639
+0.077
13.64%
jan 1, 2007
0.487
-0.152
-23.78%
jan 1, 2008
0.437
-0.049
-10.15%
jan 1, 2009
0.51
+0.073
16.66%
jan 1, 2010
0.252
-0.258
-50.61%
jan 1, 2011
0.978
+0.726
288.16%
jan 1, 2012
0.267
-0.711
-72.69%
jan 1, 2013
0.552
+0.285
106.7%
jan 1, 2014
0.325
-0.227
-41.09%
jan 1, 2015
0.379
+0.053
16.45%
Ranking of countries by current statistics by years


Comments: