29
/
en
AIzaSyAYiBZKx7MnpbEhh9jyipgxe19OcubqV5w
April 1, 2024
151807
Hong Kong SAR, China
HKG
true
2
1
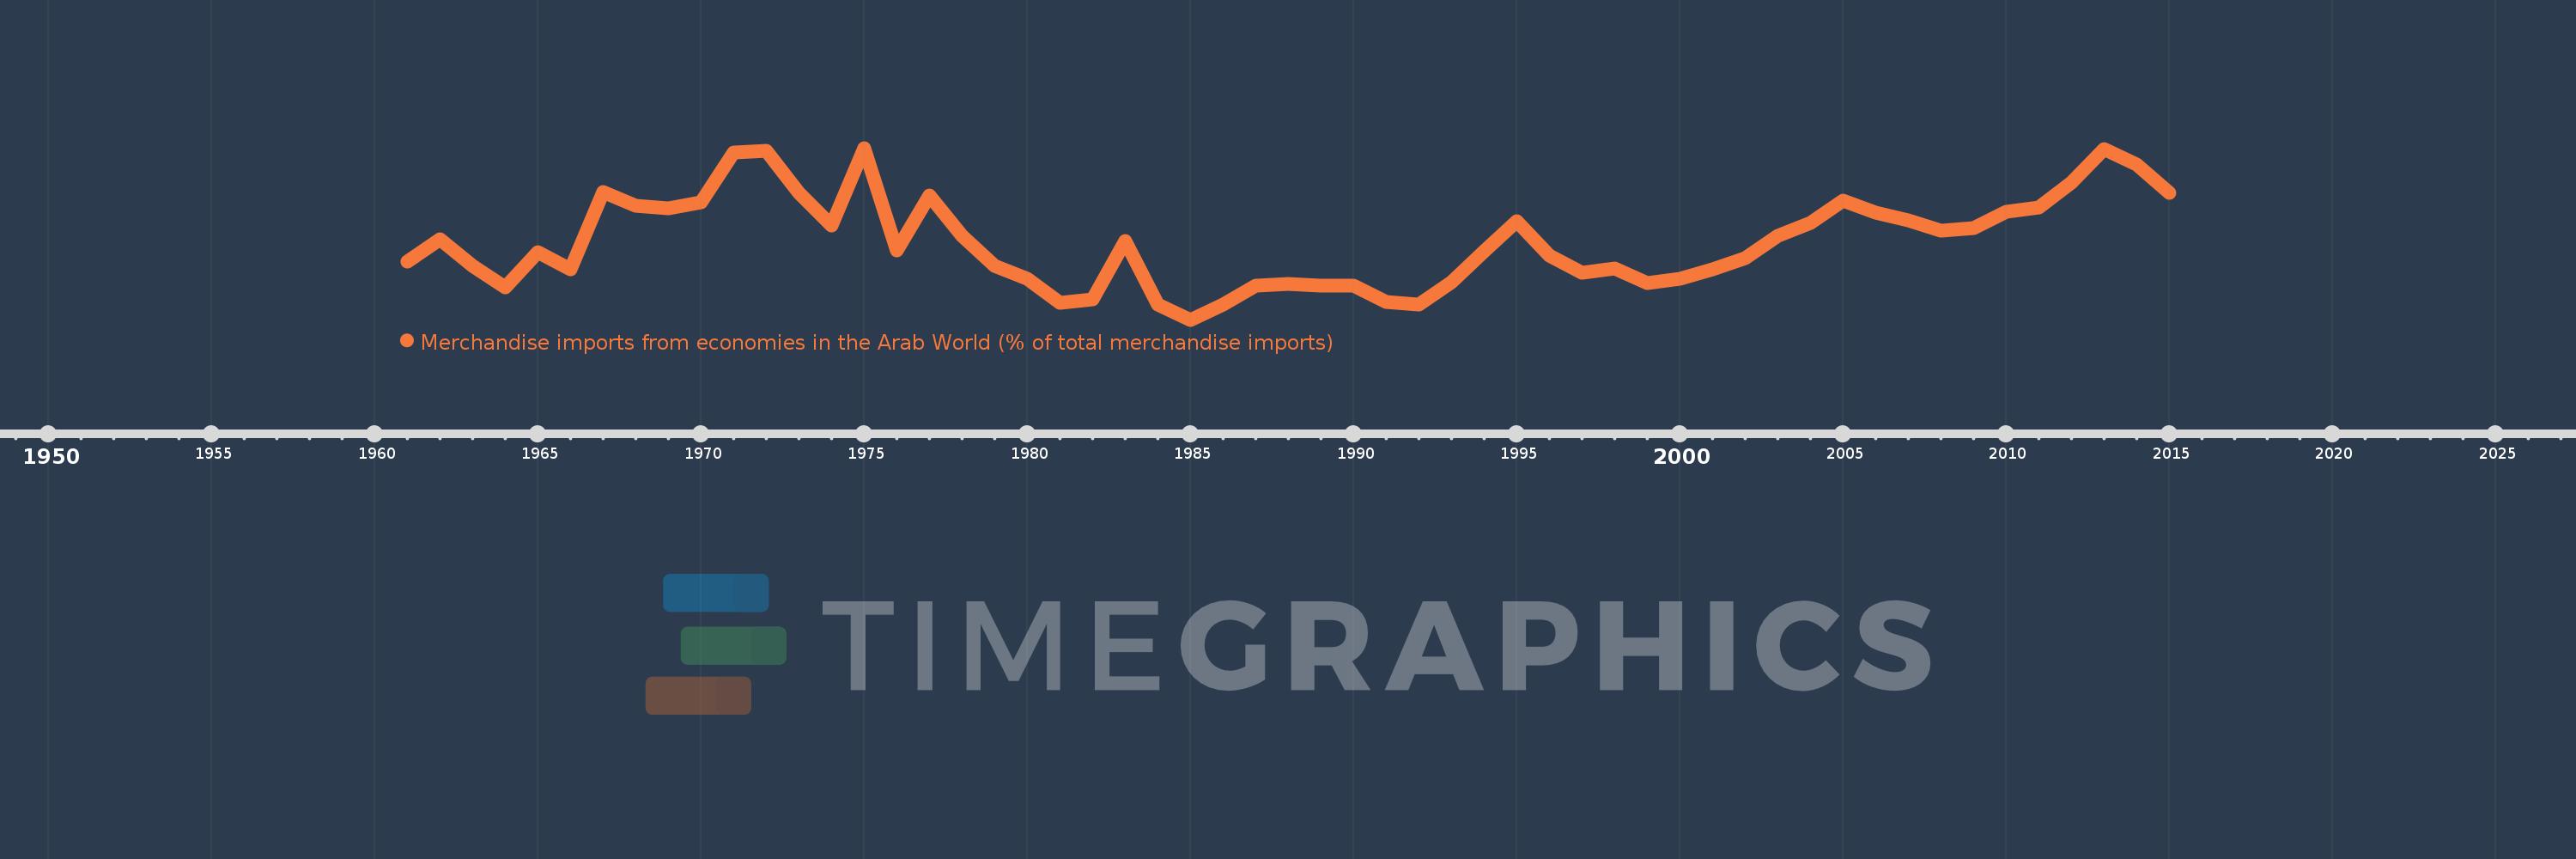
Merchandise imports from economies in the Arab World (% of total merchandise imports)
2015,2014,2013,2012,2011,2010,2009,2008,2007,2006,2005,2004,2003,2002,2001,2000,1999,1998,1997,1996,1995,1994,1993,1992,1991,1990,1989,1988,1987,1986,1985,1984,1983,1982,1981,1980,1979,1978,1977,1976,1975,1974,1973,1972,1971,1970,1969,1968,1967,1966,1965,1964,1963,1962,1961
This statistics in other country:
AfghanistanAlbaniaAlgeriaAngolaArab WorldArgentinaArmeniaArubaAustraliaAustriaAzerbaijanBahamas, TheBahrainBangladeshBarbadosBelarusBelgiumBelizeBeninBermudaBoliviaBrazilBrunei DarussalamBulgariaBurkina FasoBurundiCabo VerdeCambodiaCameroonCanadaCaribbean small statesCentral African RepublicCentral Europe and the BalticsChadChileChinaColombiaComorosCongo, Dem. Rep.Congo, Rep.Costa RicaCote d'IvoireCroatiaCubaCyprusCzech RepublicDenmarkDjiboutiDominicaDominican RepublicEarly-demographic dividendEast Asia & PacificEast Asia & Pacific (excluding high income)East Asia & Pacific (IDA & IBRD countries)EcuadorEgypt, Arab Rep.El SalvadorEstoniaEthiopiaEuro areaEurope & Central AsiaEurope & Central Asia (excluding high income)Europe & Central Asia (IDA & IBRD countries)European UnionFijiFinlandFragile and conflict affected situationsFranceFrench PolynesiaGabonGambia, TheGeorgiaGermanyGhanaGreeceGreenlandGrenadaGuatemalaGuineaGuinea-BissauGuyanaHaitiHeavily indebted poor countries (HIPC)High incomeHondurasHong Kong SAR, ChinaHungaryIBRD onlyIcelandIDA & IBRD totalIDA blendIDA onlyIDA totalIndiaIndonesiaIran, Islamic Rep.IraqIrelandItalyJamaicaJapanJordanKazakhstanKenyaKorea, Dem. People’s Rep.Korea, Rep.KuwaitKyrgyz RepublicLao PDRLate-demographic dividendLatin America & Caribbean Latin America & Caribbean (excluding high income)Latin America & the Caribbean (IDA & IBRD countries)LatviaLeast developed countries: UN classificationLebanonLiberiaLibyaLithuaniaLow & middle incomeLow incomeLower middle incomeLuxembourgMacao SAR, ChinaMacedonia, FYRMadagascarMalawiMalaysiaMaldivesMaliMaltaMauritaniaMauritiusMexicoMiddle East & North AfricaMiddle East & North Africa (excluding high income)Middle East & North Africa (IDA & IBRD countries)Middle incomeMoldovaMongoliaMontenegroMoroccoMozambiqueMyanmarNepalNetherlandsNew CaledoniaNew ZealandNicaraguaNigerNigeriaNorth AmericaNorwayOECD membersOmanOther small statesPacific island small statesPakistanPanamaPapua New GuineaParaguayPeruPhilippinesPolandPortugalPost-demographic dividendPre-demographic dividendQatarRomaniaRussian FederationRwandaSaudi ArabiaSenegalSerbiaSeychellesSierra LeoneSingaporeSlovak RepublicSloveniaSmall statesSomaliaSouth AfricaSouth AsiaSouth Asia (IDA & IBRD)SpainSri LankaSt. LuciaSt. Vincent and the GrenadinesSub-Saharan Africa Sub-Saharan Africa (excluding high income)Sub-Saharan Africa (IDA & IBRD countries)SudanSurinameSwedenSwitzerlandSyrian Arab RepublicTajikistanTanzaniaThailandTogoTrinidad and TobagoTunisiaTurkeyTurkmenistanUgandaUkraineUnited Arab EmiratesUnited KingdomUnited StatesUpper middle incomeUruguayVenezuela, RBVietnamWorldYemen, Rep.ZambiaZimbabwe Timeline:
This timeline shows a graph from 1961 to 2015 of Hong Kong SAR, China. No data until 1960. Number of actual observations by date: 55.
Source name:
World Development Indicators
Source organization:
World Bank staff estimates based data from International Monetary Fund's Direction of Trade database.
Categories, topics:
Private Sector, Trade
Last updated:
apr 23, 2017
Indicators value changes by year
At the date of observation
Value
Absolute change
Change from previous value
jan 1, 1961
0.484
+0.484
0.0%
jan 1, 1962
0.63
+0.146
30.16%
jan 1, 1963
0.458
-0.171
-27.23%
jan 1, 1964
0.316
-0.143
-31.12%
jan 1, 1965
0.548
+0.233
73.73%
jan 1, 1966
0.433
-0.116
-21.08%
jan 1, 1967
0.939
+0.506
117.03%
jan 1, 1968
0.848
-0.091
-9.69%
jan 1, 1969
0.836
-0.012
-1.39%
jan 1, 1970
0.872
+0.035
4.23%
jan 1, 1971
1.198
+0.327
37.46%
jan 1, 1972
1.212
+0.014
1.15%
jan 1, 1973
0.935
-0.277
-22.84%
jan 1, 1974
0.722
-0.213
-22.82%
jan 1, 1975
1.228
+0.506
70.16%
jan 1, 1976
0.556
-0.672
-54.69%
jan 1, 1977
0.916
+0.359
64.58%
jan 1, 1978
0.653
-0.262
-28.66%
jan 1, 1979
0.46
-0.194
-29.65%
jan 1, 1980
0.376
-0.084
-18.24%
jan 1, 1981
0.219
-0.157
-41.8%
jan 1, 1982
0.241
+0.022
10.19%
jan 1, 1983
0.623
+0.382
158.62%
jan 1, 1984
0.208
-0.415
-66.65%
jan 1, 1985
0.106
-0.102
-48.96%
jan 1, 1986
0.208
+0.102
95.8%
jan 1, 1987
0.328
+0.12
57.91%
jan 1, 1988
0.338
+0.01
2.91%
jan 1, 1989
0.331
-0.007
-2.05%
jan 1, 1990
0.329
-0.001
-0.44%
jan 1, 1991
0.224
-0.105
-31.85%
jan 1, 1992
0.207
-0.017
-7.74%
jan 1, 1993
0.35
+0.143
69.08%
jan 1, 1994
0.552
+0.202
57.59%
jan 1, 1995
0.75
+0.199
36.06%
jan 1, 1996
0.524
-0.226
-30.11%
jan 1, 1997
0.411
-0.114
-21.71%
jan 1, 1998
0.443
+0.032
7.82%
jan 1, 1999
0.347
-0.095
-21.51%
jan 1, 2000
0.372
+0.025
7.15%
jan 1, 2001
0.438
+0.066
17.61%
jan 1, 2002
0.508
+0.07
15.92%
jan 1, 2003
0.654
+0.146
28.86%
jan 1, 2004
0.737
+0.083
12.69%
jan 1, 2005
0.885
+0.147
20.0%
jan 1, 2006
0.804
-0.081
-9.16%
jan 1, 2007
0.756
-0.047
-5.87%
jan 1, 2008
0.69
-0.067
-8.81%
jan 1, 2009
0.704
+0.014
2.09%
jan 1, 2010
0.809
+0.105
14.87%
jan 1, 2011
0.838
+0.029
3.56%
jan 1, 2012
1.003
+0.165
19.74%
jan 1, 2013
1.219
+0.216
21.57%
jan 1, 2014
1.118
-0.101
-8.31%
jan 1, 2015
0.932
-0.186
-16.64%
Ranking of countries by current statistics by years


Comments: