29
/
en
AIzaSyAYiBZKx7MnpbEhh9jyipgxe19OcubqV5w
April 1, 2024
42624
Latin America & Caribbean (excluding high income)
LAC
false
2
1
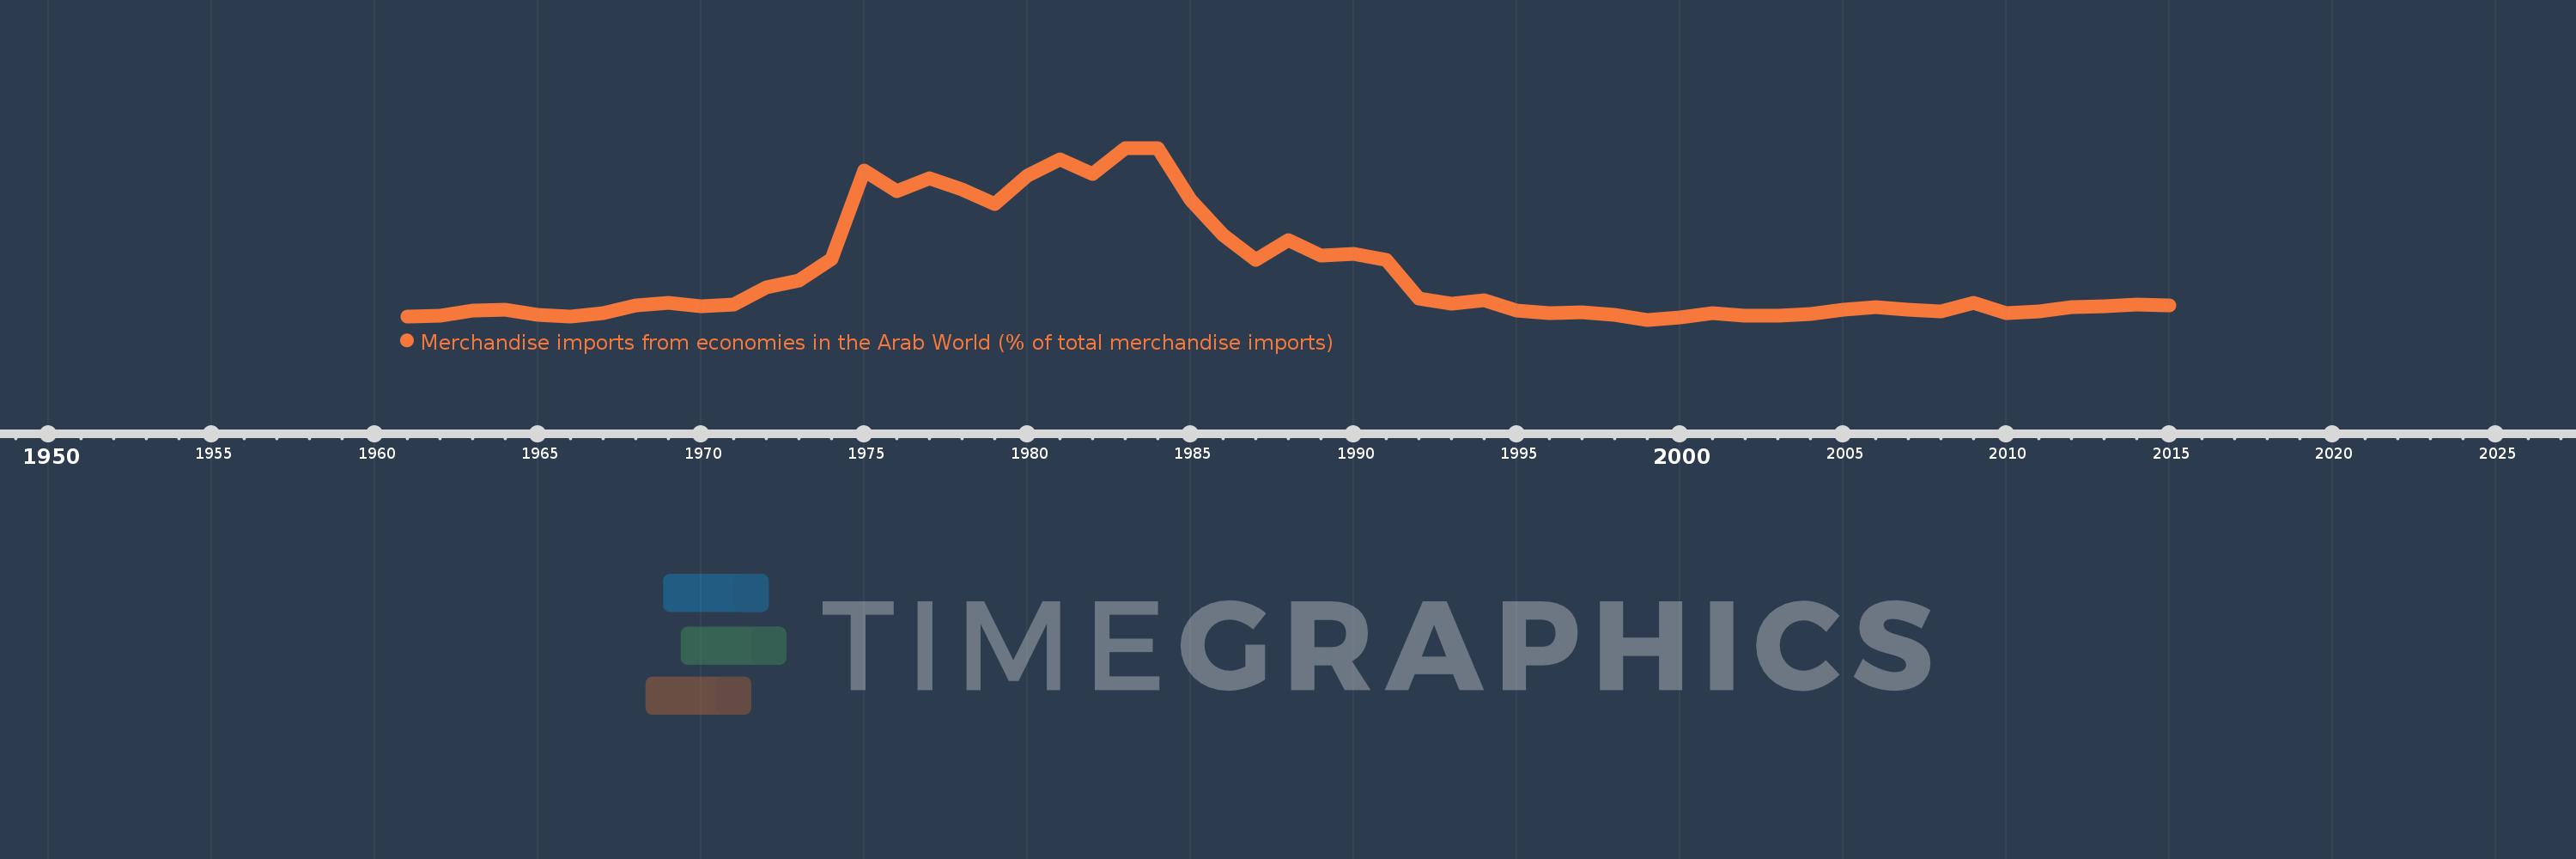
Merchandise imports from economies in the Arab World (% of total merchandise imports)
2015,2014,2013,2012,2011,2010,2009,2008,2007,2006,2005,2004,2003,2002,2001,2000,1999,1998,1997,1996,1995,1994,1993,1992,1991,1990,1989,1988,1987,1986,1985,1984,1983,1982,1981,1980,1979,1978,1977,1976,1975,1974,1973,1972,1971,1970,1969,1968,1967,1966,1965,1964,1963,1962,1961
This statistics in other country:
AfghanistanAlbaniaAlgeriaAngolaArab WorldArgentinaArmeniaArubaAustraliaAustriaAzerbaijanBahamas, TheBahrainBangladeshBarbadosBelarusBelgiumBelizeBeninBermudaBoliviaBrazilBrunei DarussalamBulgariaBurkina FasoBurundiCabo VerdeCambodiaCameroonCanadaCaribbean small statesCentral African RepublicCentral Europe and the BalticsChadChileChinaColombiaComorosCongo, Dem. Rep.Congo, Rep.Costa RicaCote d'IvoireCroatiaCubaCyprusCzech RepublicDenmarkDjiboutiDominicaDominican RepublicEarly-demographic dividendEast Asia & PacificEast Asia & Pacific (excluding high income)East Asia & Pacific (IDA & IBRD countries)EcuadorEgypt, Arab Rep.El SalvadorEstoniaEthiopiaEuro areaEurope & Central AsiaEurope & Central Asia (excluding high income)Europe & Central Asia (IDA & IBRD countries)European UnionFijiFinlandFragile and conflict affected situationsFranceFrench PolynesiaGabonGambia, TheGeorgiaGermanyGhanaGreeceGreenlandGrenadaGuatemalaGuineaGuinea-BissauGuyanaHaitiHeavily indebted poor countries (HIPC)High incomeHondurasHong Kong SAR, ChinaHungaryIBRD onlyIcelandIDA & IBRD totalIDA blendIDA onlyIDA totalIndiaIndonesiaIran, Islamic Rep.IraqIrelandItalyJamaicaJapanJordanKazakhstanKenyaKorea, Dem. People’s Rep.Korea, Rep.KuwaitKyrgyz RepublicLao PDRLate-demographic dividendLatin America & Caribbean Latin America & Caribbean (excluding high income)Latin America & the Caribbean (IDA & IBRD countries)LatviaLeast developed countries: UN classificationLebanonLiberiaLibyaLithuaniaLow & middle incomeLow incomeLower middle incomeLuxembourgMacao SAR, ChinaMacedonia, FYRMadagascarMalawiMalaysiaMaldivesMaliMaltaMauritaniaMauritiusMexicoMiddle East & North AfricaMiddle East & North Africa (excluding high income)Middle East & North Africa (IDA & IBRD countries)Middle incomeMoldovaMongoliaMontenegroMoroccoMozambiqueMyanmarNepalNetherlandsNew CaledoniaNew ZealandNicaraguaNigerNigeriaNorth AmericaNorwayOECD membersOmanOther small statesPacific island small statesPakistanPanamaPapua New GuineaParaguayPeruPhilippinesPolandPortugalPost-demographic dividendPre-demographic dividendQatarRomaniaRussian FederationRwandaSaudi ArabiaSenegalSerbiaSeychellesSierra LeoneSingaporeSlovak RepublicSloveniaSmall statesSomaliaSouth AfricaSouth AsiaSouth Asia (IDA & IBRD)SpainSri LankaSt. LuciaSt. Vincent and the GrenadinesSub-Saharan Africa Sub-Saharan Africa (excluding high income)Sub-Saharan Africa (IDA & IBRD countries)SudanSurinameSwedenSwitzerlandSyrian Arab RepublicTajikistanTanzaniaThailandTogoTrinidad and TobagoTunisiaTurkeyTurkmenistanUgandaUkraineUnited Arab EmiratesUnited KingdomUnited StatesUpper middle incomeUruguayVenezuela, RBVietnamWorldYemen, Rep.ZambiaZimbabwe Timeline:
This timeline shows a graph from 1961 to 2015 of Latin America & Caribbean (excluding high income). No data until 1960. Number of actual observations by date: 55.
Source name:
World Development Indicators
Source organization:
World Bank staff estimates based data from International Monetary Fund's Direction of Trade database.
Categories, topics:
Private Sector, Trade
Last updated:
apr 23, 2017
Indicators value changes by year
Maximum:
10.569
jan 1, 1984
At the date of observation
Value
Absolute change
Change from previous value
jan 1, 1961
0.845
+0.845
0.0%
jan 1, 1962
0.929
+0.084
9.94%
jan 1, 1963
1.213
+0.284
30.56%
jan 1, 1964
1.242
+0.029
2.43%
jan 1, 1965
0.948
-0.294
-23.66%
jan 1, 1966
0.856
-0.092
-9.68%
jan 1, 1967
1.041
+0.185
21.56%
jan 1, 1968
1.509
+0.468
44.96%
jan 1, 1969
1.644
+0.135
8.91%
jan 1, 1970
1.46
-0.183
-11.16%
jan 1, 1971
1.563
+0.102
7.02%
jan 1, 1972
2.533
+0.971
62.12%
jan 1, 1973
2.932
+0.399
15.75%
jan 1, 1974
4.163
+1.23
41.96%
jan 1, 1975
9.273
+5.11
122.75%
jan 1, 1976
8.076
-1.197
-12.91%
jan 1, 1977
8.821
+0.745
9.22%
jan 1, 1978
8.192
-0.629
-7.13%
jan 1, 1979
7.356
-0.836
-10.2%
jan 1, 1980
8.984
+1.628
22.13%
jan 1, 1981
9.893
+0.909
10.12%
jan 1, 1982
9.068
-0.825
-8.34%
jan 1, 1983
10.553
+1.485
16.38%
jan 1, 1984
10.569
+0.016
0.16%
jan 1, 1985
7.588
-2.981
-28.21%
jan 1, 1986
5.571
-2.017
-26.58%
jan 1, 1987
4.139
-1.432
-25.7%
jan 1, 1988
5.262
+1.122
27.11%
jan 1, 1989
4.385
-0.876
-16.65%
jan 1, 1990
4.468
+0.082
1.88%
jan 1, 1991
4.147
-0.321
-7.18%
jan 1, 1992
1.91
-2.237
-53.93%
jan 1, 1993
1.618
-0.292
-15.31%
jan 1, 1994
1.821
+0.203
12.58%
jan 1, 1995
1.226
-0.595
-32.69%
jan 1, 1996
1.071
-0.155
-12.67%
jan 1, 1997
1.109
+0.039
3.62%
jan 1, 1998
0.954
-0.155
-13.97%
jan 1, 1999
0.679
-0.275
-28.81%
jan 1, 2000
0.808
+0.128
18.91%
jan 1, 2001
1.065
+0.257
31.8%
jan 1, 2002
0.916
-0.149
-13.99%
jan 1, 2003
0.922
+0.006
0.68%
jan 1, 2004
1.02
+0.098
10.58%
jan 1, 2005
1.264
+0.244
23.93%
jan 1, 2006
1.429
+0.165
13.09%
jan 1, 2007
1.259
-0.17
-11.88%
jan 1, 2008
1.173
-0.086
-6.86%
jan 1, 2009
1.638
+0.465
39.67%
jan 1, 2010
1.043
-0.595
-36.31%
jan 1, 2011
1.151
+0.108
10.31%
jan 1, 2012
1.39
+0.239
20.77%
jan 1, 2013
1.453
+0.063
4.52%
jan 1, 2014
1.561
+0.109
7.49%
jan 1, 2015
1.523
-0.039
-2.47%
Ranking of countries by current statistics by years


Comments: