29
/
en
AIzaSyAYiBZKx7MnpbEhh9jyipgxe19OcubqV5w
April 1, 2024
113869
Cote d'Ivoire
CIV
true
2
1
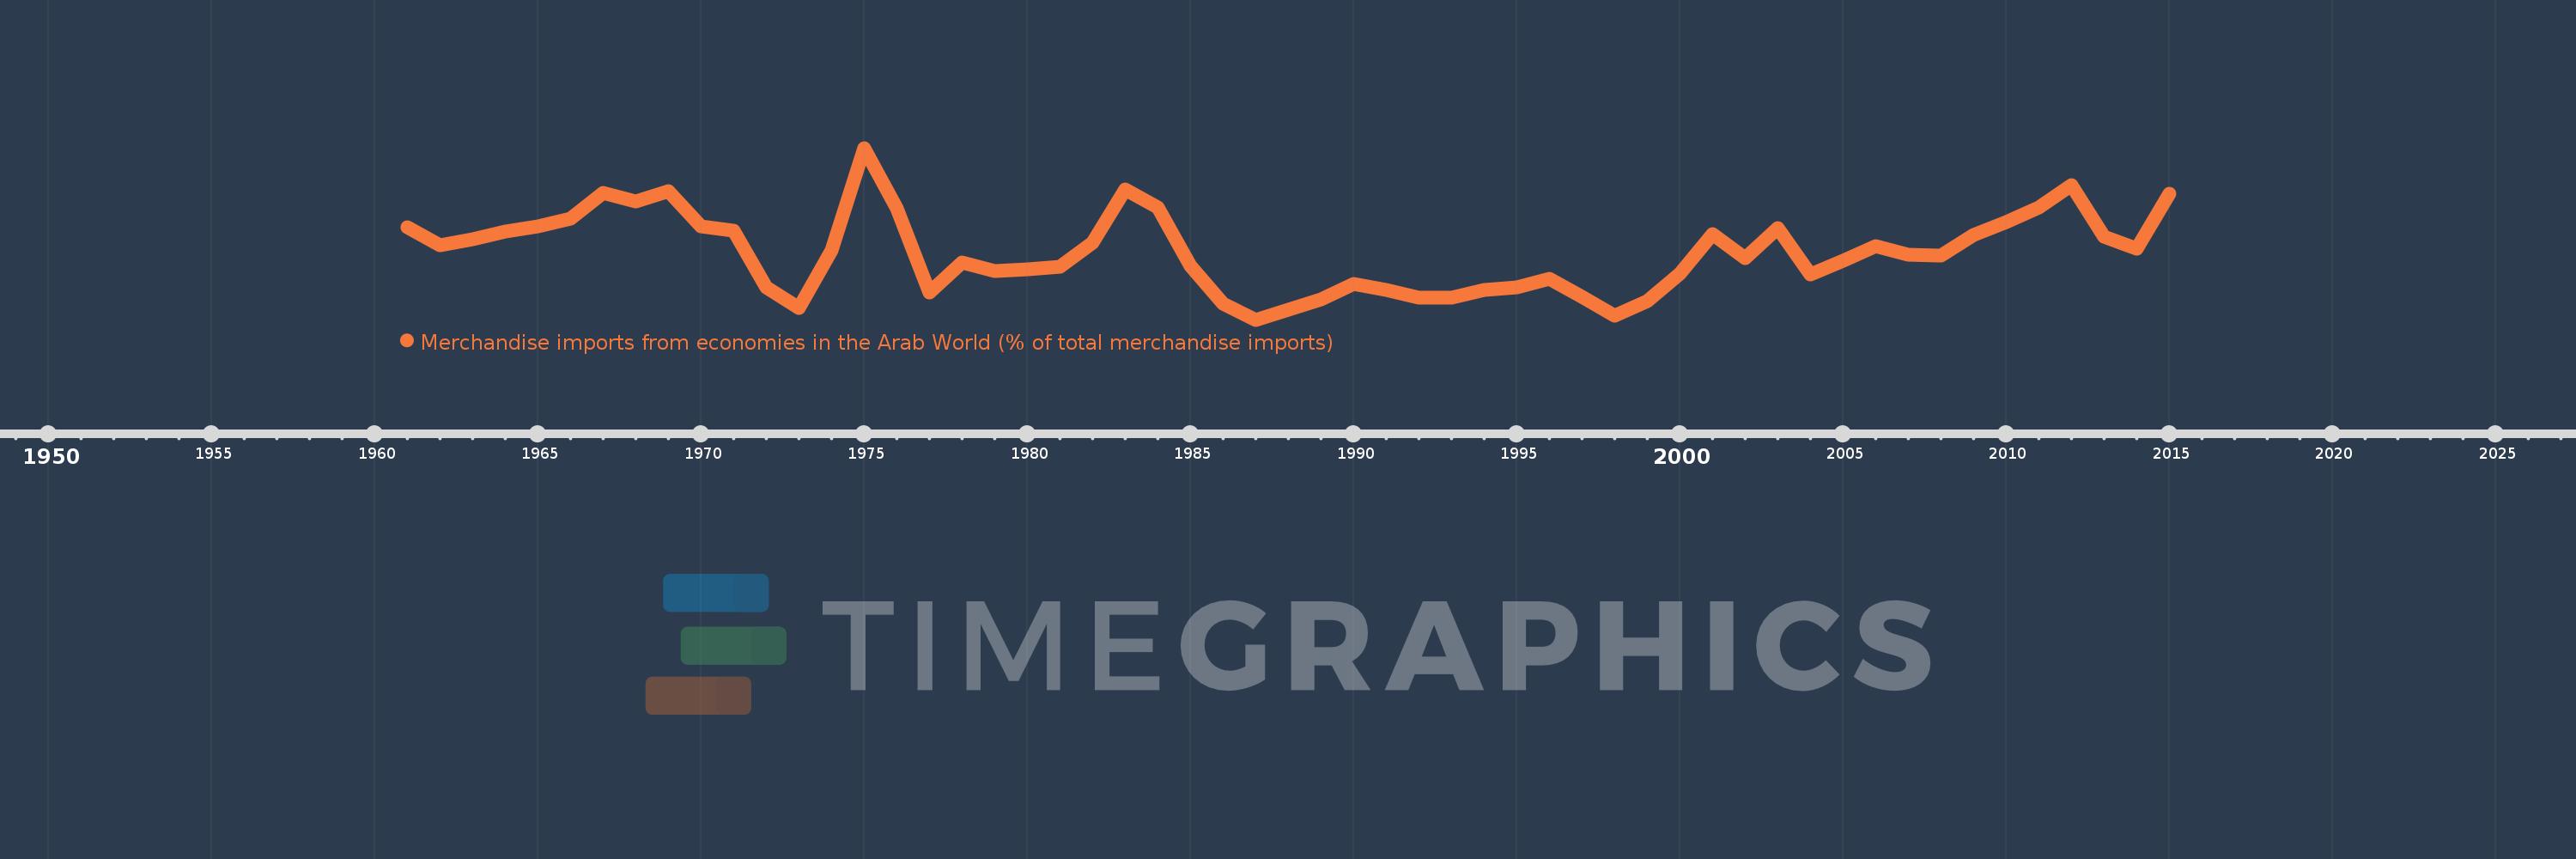
Merchandise imports from economies in the Arab World (% of total merchandise imports)
2015,2014,2013,2012,2011,2010,2009,2008,2007,2006,2005,2004,2003,2002,2001,2000,1999,1998,1997,1996,1995,1994,1993,1992,1991,1990,1989,1988,1987,1986,1985,1984,1983,1982,1981,1980,1979,1978,1977,1976,1975,1974,1973,1972,1971,1970,1969,1968,1967,1966,1965,1964,1963,1962,1961
This statistics in other country:
AfghanistanAlbaniaAlgeriaAngolaArab WorldArgentinaArmeniaArubaAustraliaAustriaAzerbaijanBahamas, TheBahrainBangladeshBarbadosBelarusBelgiumBelizeBeninBermudaBoliviaBrazilBrunei DarussalamBulgariaBurkina FasoBurundiCabo VerdeCambodiaCameroonCanadaCaribbean small statesCentral African RepublicCentral Europe and the BalticsChadChileChinaColombiaComorosCongo, Dem. Rep.Congo, Rep.Costa RicaCote d'IvoireCroatiaCubaCyprusCzech RepublicDenmarkDjiboutiDominicaDominican RepublicEarly-demographic dividendEast Asia & PacificEast Asia & Pacific (excluding high income)East Asia & Pacific (IDA & IBRD countries)EcuadorEgypt, Arab Rep.El SalvadorEstoniaEthiopiaEuro areaEurope & Central AsiaEurope & Central Asia (excluding high income)Europe & Central Asia (IDA & IBRD countries)European UnionFijiFinlandFragile and conflict affected situationsFranceFrench PolynesiaGabonGambia, TheGeorgiaGermanyGhanaGreeceGreenlandGrenadaGuatemalaGuineaGuinea-BissauGuyanaHaitiHeavily indebted poor countries (HIPC)High incomeHondurasHong Kong SAR, ChinaHungaryIBRD onlyIcelandIDA & IBRD totalIDA blendIDA onlyIDA totalIndiaIndonesiaIran, Islamic Rep.IraqIrelandItalyJamaicaJapanJordanKazakhstanKenyaKorea, Dem. People’s Rep.Korea, Rep.KuwaitKyrgyz RepublicLao PDRLate-demographic dividendLatin America & Caribbean Latin America & Caribbean (excluding high income)Latin America & the Caribbean (IDA & IBRD countries)LatviaLeast developed countries: UN classificationLebanonLiberiaLibyaLithuaniaLow & middle incomeLow incomeLower middle incomeLuxembourgMacao SAR, ChinaMacedonia, FYRMadagascarMalawiMalaysiaMaldivesMaliMaltaMauritaniaMauritiusMexicoMiddle East & North AfricaMiddle East & North Africa (excluding high income)Middle East & North Africa (IDA & IBRD countries)Middle incomeMoldovaMongoliaMontenegroMoroccoMozambiqueMyanmarNepalNetherlandsNew CaledoniaNew ZealandNicaraguaNigerNigeriaNorth AmericaNorwayOECD membersOmanOther small statesPacific island small statesPakistanPanamaPapua New GuineaParaguayPeruPhilippinesPolandPortugalPost-demographic dividendPre-demographic dividendQatarRomaniaRussian FederationRwandaSaudi ArabiaSenegalSerbiaSeychellesSierra LeoneSingaporeSlovak RepublicSloveniaSmall statesSomaliaSouth AfricaSouth AsiaSouth Asia (IDA & IBRD)SpainSri LankaSt. LuciaSt. Vincent and the GrenadinesSub-Saharan Africa Sub-Saharan Africa (excluding high income)Sub-Saharan Africa (IDA & IBRD countries)SudanSurinameSwedenSwitzerlandSyrian Arab RepublicTajikistanTanzaniaThailandTogoTrinidad and TobagoTunisiaTurkeyTurkmenistanUgandaUkraineUnited Arab EmiratesUnited KingdomUnited StatesUpper middle incomeUruguayVenezuela, RBVietnamWorldYemen, Rep.ZambiaZimbabwe Timeline:
This timeline shows a graph from 1961 to 2015 of Cote d'Ivoire. No data until 1960. Number of actual observations by date: 55.
Source name:
World Development Indicators
Source organization:
World Bank staff estimates based data from International Monetary Fund's Direction of Trade database.
Categories, topics:
Private Sector, Trade
Last updated:
apr 23, 2017
Indicators value changes by year
At the date of observation
Value
Absolute change
Change from previous value
jan 1, 1961
4.386
+4.386
0.0%
jan 1, 1962
3.732
-0.654
-14.91%
jan 1, 1963
3.969
+0.237
6.35%
jan 1, 1964
4.238
+0.269
6.76%
jan 1, 1965
4.417
+0.179
4.23%
jan 1, 1966
4.705
+0.288
6.52%
jan 1, 1967
5.668
+0.962
20.45%
jan 1, 1968
5.343
-0.324
-5.72%
jan 1, 1969
5.742
+0.398
7.46%
jan 1, 1970
4.438
-1.304
-22.71%
jan 1, 1971
4.278
-0.16
-3.6%
jan 1, 1972
2.181
-2.098
-49.03%
jan 1, 1973
1.412
-0.769
-35.26%
jan 1, 1974
3.532
+2.12
150.2%
jan 1, 1975
7.318
+3.786
107.19%
jan 1, 1976
5.089
-2.229
-30.46%
jan 1, 1977
2.005
-3.084
-60.6%
jan 1, 1978
3.108
+1.103
54.99%
jan 1, 1979
2.801
-0.307
-9.88%
jan 1, 1980
2.857
+0.056
1.99%
jan 1, 1981
2.936
+0.079
2.77%
jan 1, 1982
3.838
+0.902
30.72%
jan 1, 1983
5.793
+1.955
50.94%
jan 1, 1984
5.131
-0.662
-11.43%
jan 1, 1985
2.986
-2.145
-41.8%
jan 1, 1986
1.584
-1.403
-46.97%
jan 1, 1987
0.993
-0.591
-37.3%
jan 1, 1988
1.369
+0.376
37.89%
jan 1, 1989
1.741
+0.372
27.15%
jan 1, 1990
2.308
+0.567
32.58%
jan 1, 1991
2.095
-0.213
-9.24%
jan 1, 1992
1.808
-0.286
-13.66%
jan 1, 1993
1.818
+0.01
0.54%
jan 1, 1994
2.087
+0.269
14.77%
jan 1, 1995
2.18
+0.093
4.47%
jan 1, 1996
2.495
+0.315
14.45%
jan 1, 1997
1.837
-0.658
-26.37%
jan 1, 1998
1.126
-0.711
-38.71%
jan 1, 1999
1.67
+0.544
48.32%
jan 1, 2000
2.691
+1.021
61.14%
jan 1, 2001
4.133
+1.443
53.62%
jan 1, 2002
3.275
-0.858
-20.77%
jan 1, 2003
4.38
+1.105
33.74%
jan 1, 2004
2.659
-1.721
-39.3%
jan 1, 2005
3.161
+0.502
18.89%
jan 1, 2006
3.688
+0.527
16.69%
jan 1, 2007
3.372
-0.316
-8.58%
jan 1, 2008
3.36
-0.012
-0.34%
jan 1, 2009
4.111
+0.751
22.35%
jan 1, 2010
4.599
+0.487
11.86%
jan 1, 2011
5.125
+0.526
11.43%
jan 1, 2012
5.961
+0.836
16.32%
jan 1, 2013
4.037
-1.924
-32.28%
jan 1, 2014
3.621
-0.416
-10.31%
jan 1, 2015
5.627
+2.006
55.39%
Ranking of countries by current statistics by years


Comments: