29
/
en
AIzaSyAYiBZKx7MnpbEhh9jyipgxe19OcubqV5w
April 1, 2024
50219
Middle East & North Africa (IDA & IBRD countries)
TMN
false
2
1
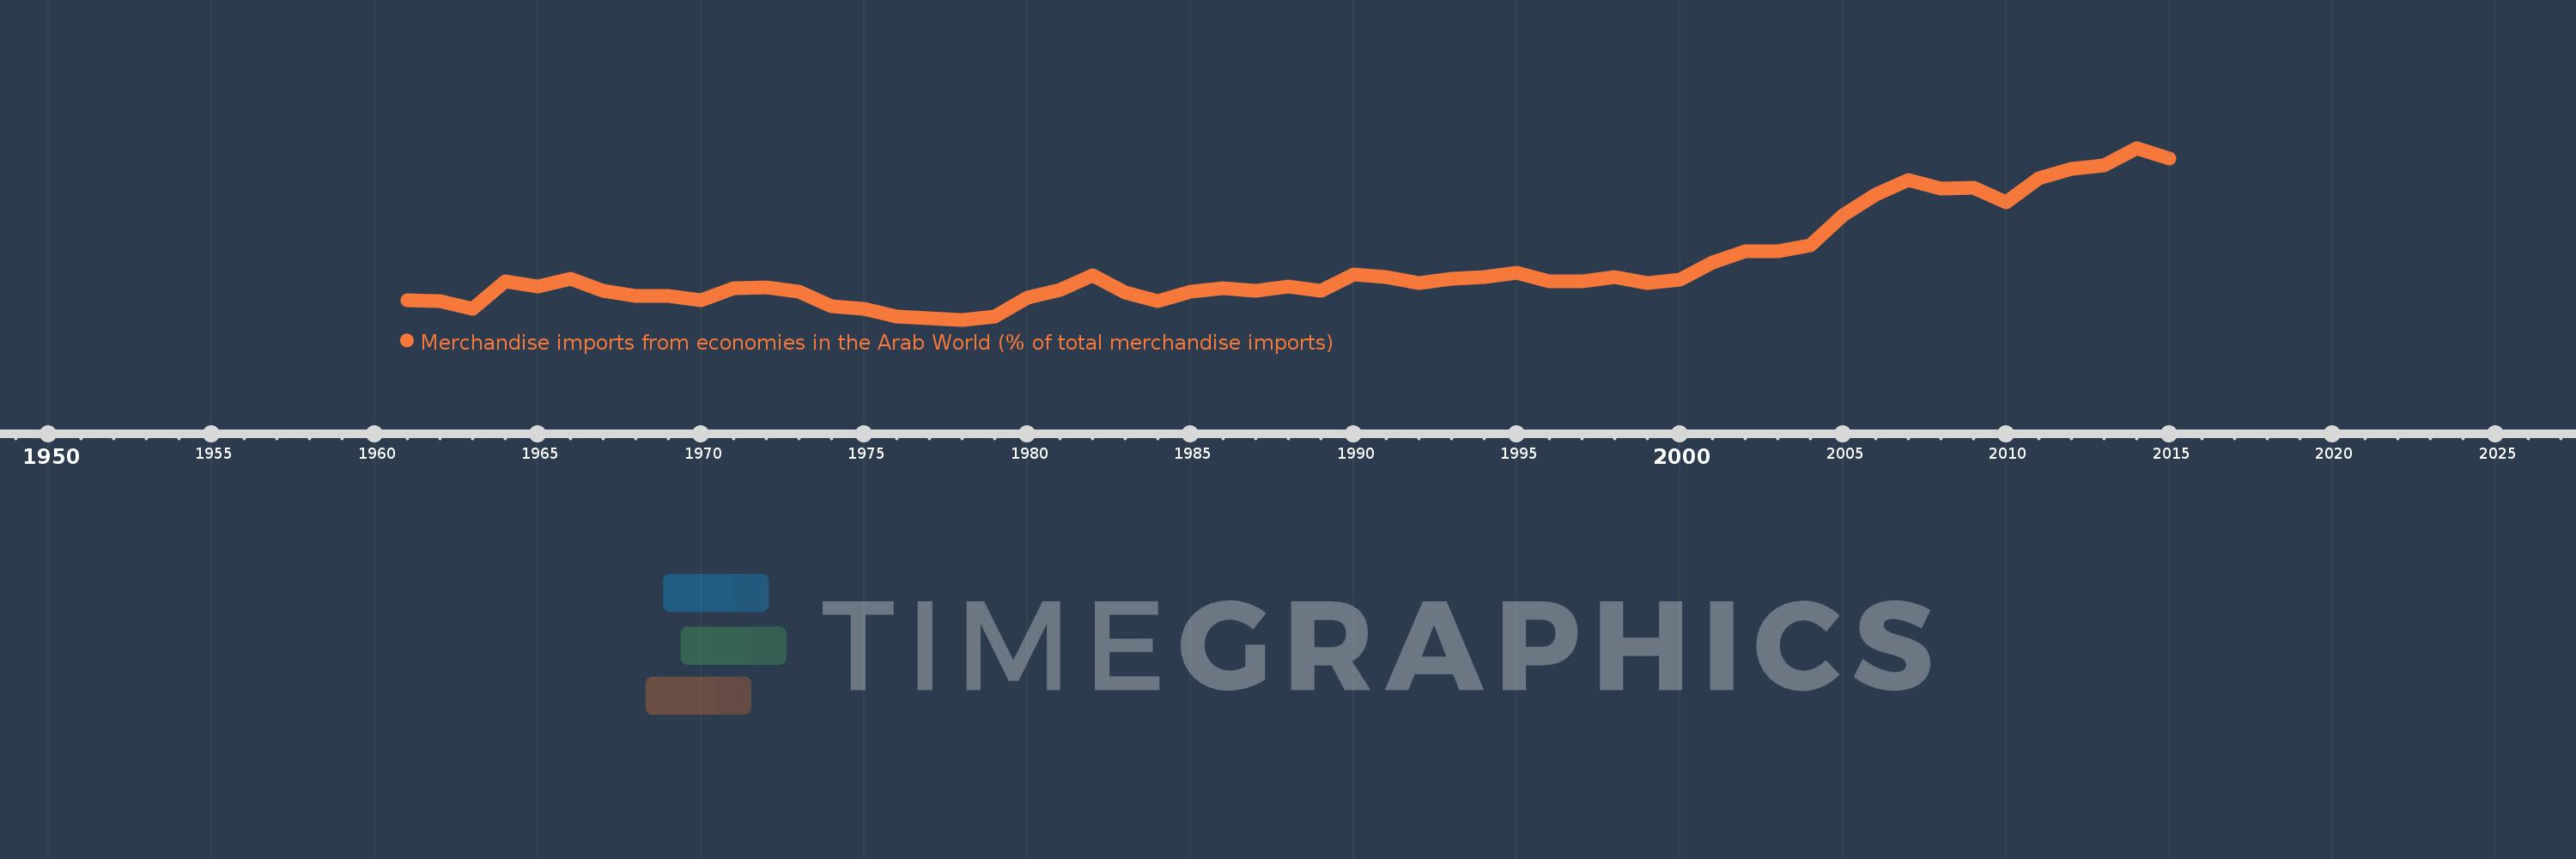
Merchandise imports from economies in the Arab World (% of total merchandise imports)
2015,2014,2013,2012,2011,2010,2009,2008,2007,2006,2005,2004,2003,2002,2001,2000,1999,1998,1997,1996,1995,1994,1993,1992,1991,1990,1989,1988,1987,1986,1985,1984,1983,1982,1981,1980,1979,1978,1977,1976,1975,1974,1973,1972,1971,1970,1969,1968,1967,1966,1965,1964,1963,1962,1961
This statistics in other country:
AfghanistanAlbaniaAlgeriaAngolaArab WorldArgentinaArmeniaArubaAustraliaAustriaAzerbaijanBahamas, TheBahrainBangladeshBarbadosBelarusBelgiumBelizeBeninBermudaBoliviaBrazilBrunei DarussalamBulgariaBurkina FasoBurundiCabo VerdeCambodiaCameroonCanadaCaribbean small statesCentral African RepublicCentral Europe and the BalticsChadChileChinaColombiaComorosCongo, Dem. Rep.Congo, Rep.Costa RicaCote d'IvoireCroatiaCubaCyprusCzech RepublicDenmarkDjiboutiDominicaDominican RepublicEarly-demographic dividendEast Asia & PacificEast Asia & Pacific (excluding high income)East Asia & Pacific (IDA & IBRD countries)EcuadorEgypt, Arab Rep.El SalvadorEstoniaEthiopiaEuro areaEurope & Central AsiaEurope & Central Asia (excluding high income)Europe & Central Asia (IDA & IBRD countries)European UnionFijiFinlandFragile and conflict affected situationsFranceFrench PolynesiaGabonGambia, TheGeorgiaGermanyGhanaGreeceGreenlandGrenadaGuatemalaGuineaGuinea-BissauGuyanaHaitiHeavily indebted poor countries (HIPC)High incomeHondurasHong Kong SAR, ChinaHungaryIBRD onlyIcelandIDA & IBRD totalIDA blendIDA onlyIDA totalIndiaIndonesiaIran, Islamic Rep.IraqIrelandItalyJamaicaJapanJordanKazakhstanKenyaKorea, Dem. People’s Rep.Korea, Rep.KuwaitKyrgyz RepublicLao PDRLate-demographic dividendLatin America & Caribbean Latin America & Caribbean (excluding high income)Latin America & the Caribbean (IDA & IBRD countries)LatviaLeast developed countries: UN classificationLebanonLiberiaLibyaLithuaniaLow & middle incomeLow incomeLower middle incomeLuxembourgMacao SAR, ChinaMacedonia, FYRMadagascarMalawiMalaysiaMaldivesMaliMaltaMauritaniaMauritiusMexicoMiddle East & North AfricaMiddle East & North Africa (excluding high income)Middle East & North Africa (IDA & IBRD countries)Middle incomeMoldovaMongoliaMontenegroMoroccoMozambiqueMyanmarNepalNetherlandsNew CaledoniaNew ZealandNicaraguaNigerNigeriaNorth AmericaNorwayOECD membersOmanOther small statesPacific island small statesPakistanPanamaPapua New GuineaParaguayPeruPhilippinesPolandPortugalPost-demographic dividendPre-demographic dividendQatarRomaniaRussian FederationRwandaSaudi ArabiaSenegalSerbiaSeychellesSierra LeoneSingaporeSlovak RepublicSloveniaSmall statesSomaliaSouth AfricaSouth AsiaSouth Asia (IDA & IBRD)SpainSri LankaSt. LuciaSt. Vincent and the GrenadinesSub-Saharan Africa Sub-Saharan Africa (excluding high income)Sub-Saharan Africa (IDA & IBRD countries)SudanSurinameSwedenSwitzerlandSyrian Arab RepublicTajikistanTanzaniaThailandTogoTrinidad and TobagoTunisiaTurkeyTurkmenistanUgandaUkraineUnited Arab EmiratesUnited KingdomUnited StatesUpper middle incomeUruguayVenezuela, RBVietnamWorldYemen, Rep.ZambiaZimbabwe Timeline:
This timeline shows a graph from 1961 to 2015 of Middle East & North Africa (IDA & IBRD countries). No data until 1960. Number of actual observations by date: 55.
Source name:
World Development Indicators
Source organization:
World Bank staff estimates based data from International Monetary Fund's Direction of Trade database.
Categories, topics:
Private Sector, Trade
Last updated:
apr 23, 2017
Indicators value changes by year
Maximum:
24.295
jan 1, 2014
At the date of observation
Value
Absolute change
Change from previous value
jan 1, 1961
5.115
+5.115
0.0%
jan 1, 1962
5.003
-0.112
-2.19%
jan 1, 1963
4.07
-0.933
-18.65%
jan 1, 1964
7.475
+3.405
83.67%
jan 1, 1965
6.874
-0.601
-8.04%
jan 1, 1966
7.805
+0.93
13.53%
jan 1, 1967
6.295
-1.51
-19.34%
jan 1, 1968
5.704
-0.591
-9.39%
jan 1, 1969
5.634
-0.07
-1.23%
jan 1, 1970
5.14
-0.494
-8.76%
jan 1, 1971
6.59
+1.45
28.22%
jan 1, 1972
6.794
+0.204
3.09%
jan 1, 1973
6.204
-0.59
-8.69%
jan 1, 1974
4.351
-1.853
-29.87%
jan 1, 1975
4.08
-0.271
-6.23%
jan 1, 1976
3.032
-1.048
-25.7%
jan 1, 1977
2.904
-0.127
-4.2%
jan 1, 1978
2.669
-0.235
-8.1%
jan 1, 1979
3.075
+0.406
15.19%
jan 1, 1980
5.488
+2.413
78.49%
jan 1, 1981
6.452
+0.964
17.57%
jan 1, 1982
8.24
+1.788
27.71%
jan 1, 1983
6.063
-2.177
-26.42%
jan 1, 1984
4.978
-1.085
-17.9%
jan 1, 1985
6.195
+1.218
24.46%
jan 1, 1986
6.594
+0.398
6.43%
jan 1, 1987
6.305
-0.289
-4.38%
jan 1, 1988
6.842
+0.538
8.53%
jan 1, 1989
6.325
-0.517
-7.56%
jan 1, 1990
8.334
+2.009
31.77%
jan 1, 1991
8.052
-0.283
-3.39%
jan 1, 1992
7.244
-0.808
-10.03%
jan 1, 1993
7.834
+0.59
8.14%
jan 1, 1994
8.09
+0.256
3.27%
jan 1, 1995
8.548
+0.458
5.66%
jan 1, 1996
7.555
-0.993
-11.61%
jan 1, 1997
7.515
-0.04
-0.53%
jan 1, 1998
8.075
+0.56
7.45%
jan 1, 1999
7.292
-0.783
-9.7%
jan 1, 2000
7.756
+0.463
6.35%
jan 1, 2001
9.883
+2.128
27.44%
jan 1, 2002
11.3
+1.417
14.34%
jan 1, 2003
11.326
+0.026
0.23%
jan 1, 2004
12.059
+0.733
6.48%
jan 1, 2005
15.78
+3.721
30.85%
jan 1, 2006
18.4
+2.62
16.6%
jan 1, 2007
20.233
+1.834
9.97%
jan 1, 2008
19.204
-1.029
-5.09%
jan 1, 2009
19.32
+0.115
0.6%
jan 1, 2010
17.477
-1.843
-9.54%
jan 1, 2011
20.462
+2.985
17.08%
jan 1, 2012
21.665
+1.203
5.88%
jan 1, 2013
22.053
+0.389
1.79%
jan 1, 2014
24.295
+2.242
10.17%
jan 1, 2015
23.002
-1.293
-5.32%
Ranking of countries by current statistics by years


Comments: