29
/
en
AIzaSyAYiBZKx7MnpbEhh9jyipgxe19OcubqV5w
April 1, 2024
54989
Post-demographic dividend
PST
false
2
1
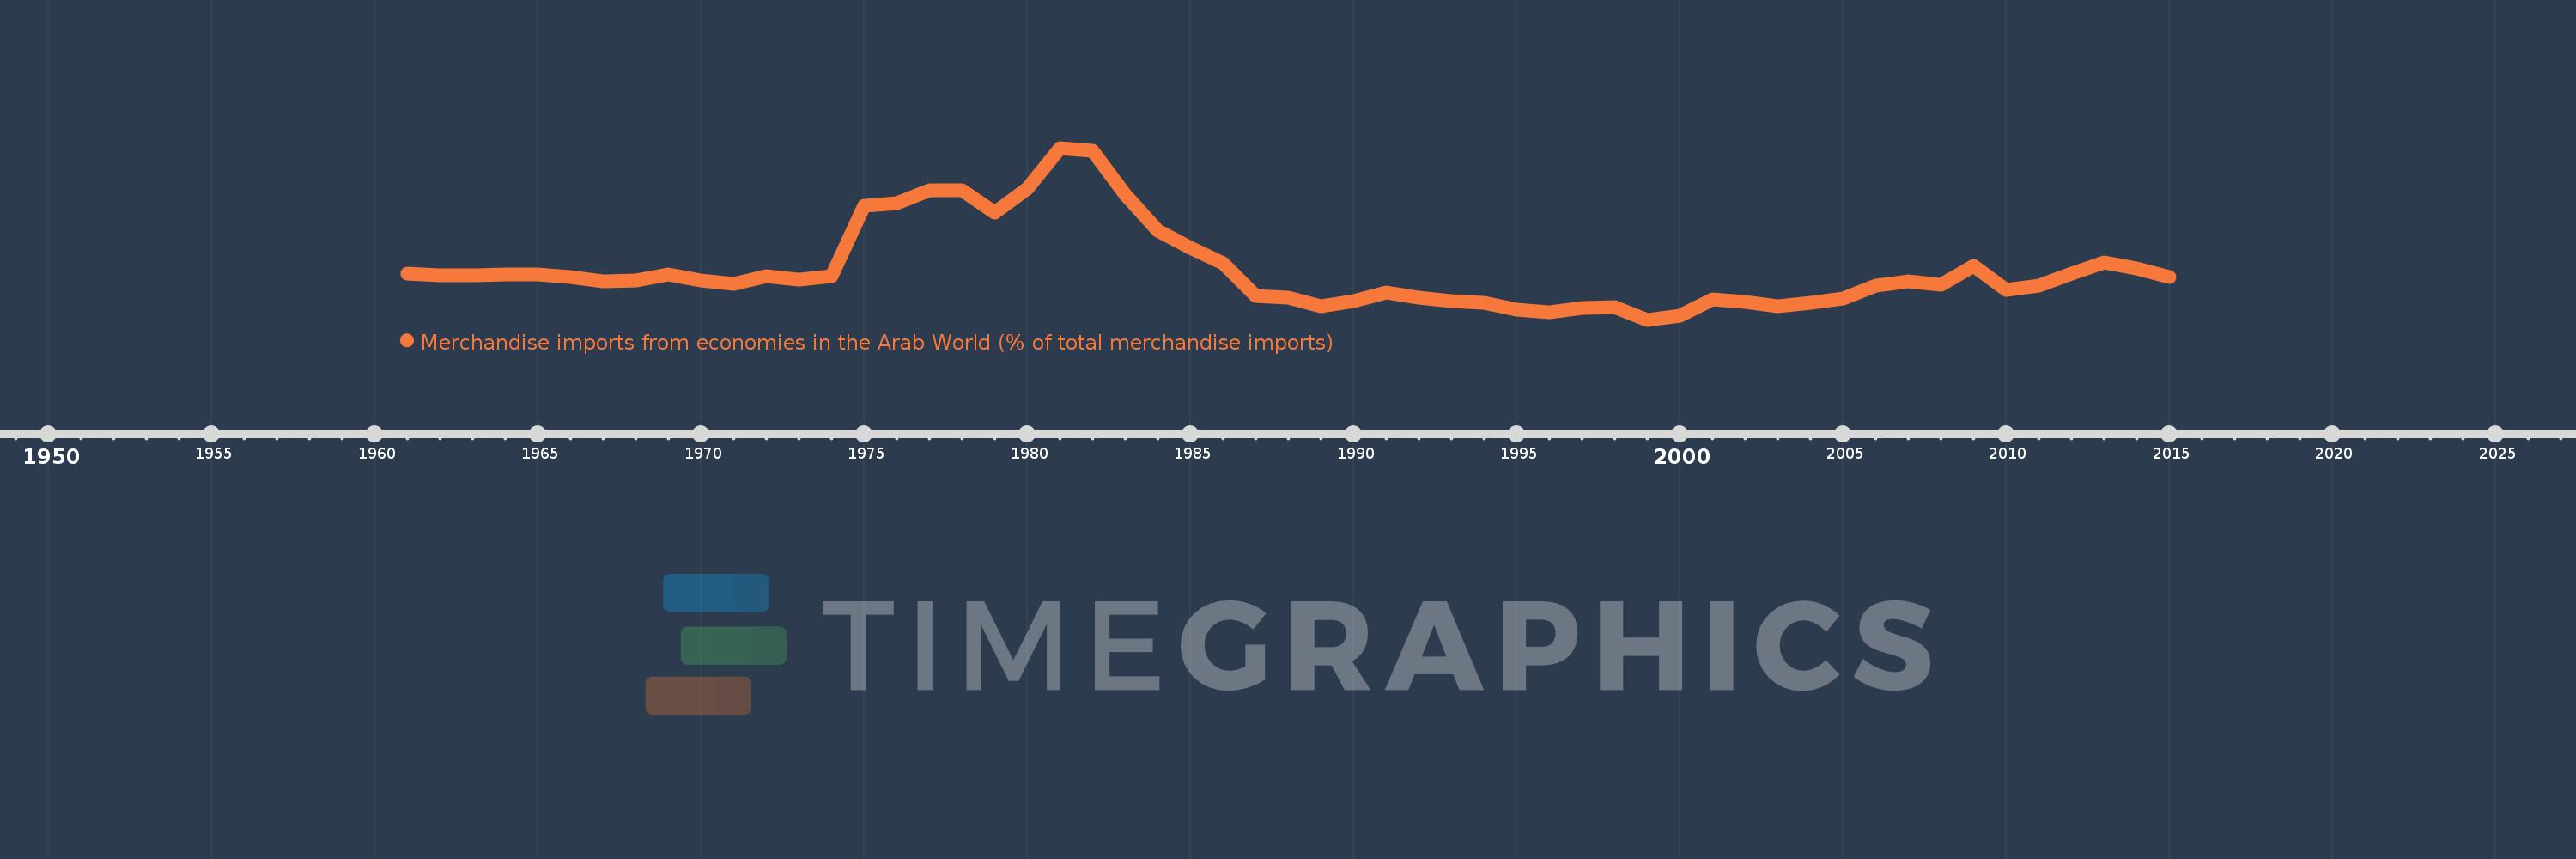
Merchandise imports from economies in the Arab World (% of total merchandise imports)
2015,2014,2013,2012,2011,2010,2009,2008,2007,2006,2005,2004,2003,2002,2001,2000,1999,1998,1997,1996,1995,1994,1993,1992,1991,1990,1989,1988,1987,1986,1985,1984,1983,1982,1981,1980,1979,1978,1977,1976,1975,1974,1973,1972,1971,1970,1969,1968,1967,1966,1965,1964,1963,1962,1961
This statistics in other country:
AfghanistanAlbaniaAlgeriaAngolaArab WorldArgentinaArmeniaArubaAustraliaAustriaAzerbaijanBahamas, TheBahrainBangladeshBarbadosBelarusBelgiumBelizeBeninBermudaBoliviaBrazilBrunei DarussalamBulgariaBurkina FasoBurundiCabo VerdeCambodiaCameroonCanadaCaribbean small statesCentral African RepublicCentral Europe and the BalticsChadChileChinaColombiaComorosCongo, Dem. Rep.Congo, Rep.Costa RicaCote d'IvoireCroatiaCubaCyprusCzech RepublicDenmarkDjiboutiDominicaDominican RepublicEarly-demographic dividendEast Asia & PacificEast Asia & Pacific (excluding high income)East Asia & Pacific (IDA & IBRD countries)EcuadorEgypt, Arab Rep.El SalvadorEstoniaEthiopiaEuro areaEurope & Central AsiaEurope & Central Asia (excluding high income)Europe & Central Asia (IDA & IBRD countries)European UnionFijiFinlandFragile and conflict affected situationsFranceFrench PolynesiaGabonGambia, TheGeorgiaGermanyGhanaGreeceGreenlandGrenadaGuatemalaGuineaGuinea-BissauGuyanaHaitiHeavily indebted poor countries (HIPC)High incomeHondurasHong Kong SAR, ChinaHungaryIBRD onlyIcelandIDA & IBRD totalIDA blendIDA onlyIDA totalIndiaIndonesiaIran, Islamic Rep.IraqIrelandItalyJamaicaJapanJordanKazakhstanKenyaKorea, Dem. People’s Rep.Korea, Rep.KuwaitKyrgyz RepublicLao PDRLate-demographic dividendLatin America & Caribbean Latin America & Caribbean (excluding high income)Latin America & the Caribbean (IDA & IBRD countries)LatviaLeast developed countries: UN classificationLebanonLiberiaLibyaLithuaniaLow & middle incomeLow incomeLower middle incomeLuxembourgMacao SAR, ChinaMacedonia, FYRMadagascarMalawiMalaysiaMaldivesMaliMaltaMauritaniaMauritiusMexicoMiddle East & North AfricaMiddle East & North Africa (excluding high income)Middle East & North Africa (IDA & IBRD countries)Middle incomeMoldovaMongoliaMontenegroMoroccoMozambiqueMyanmarNepalNetherlandsNew CaledoniaNew ZealandNicaraguaNigerNigeriaNorth AmericaNorwayOECD membersOmanOther small statesPacific island small statesPakistanPanamaPapua New GuineaParaguayPeruPhilippinesPolandPortugalPost-demographic dividendPre-demographic dividendQatarRomaniaRussian FederationRwandaSaudi ArabiaSenegalSerbiaSeychellesSierra LeoneSingaporeSlovak RepublicSloveniaSmall statesSomaliaSouth AfricaSouth AsiaSouth Asia (IDA & IBRD)SpainSri LankaSt. LuciaSt. Vincent and the GrenadinesSub-Saharan Africa Sub-Saharan Africa (excluding high income)Sub-Saharan Africa (IDA & IBRD countries)SudanSurinameSwedenSwitzerlandSyrian Arab RepublicTajikistanTanzaniaThailandTogoTrinidad and TobagoTunisiaTurkeyTurkmenistanUgandaUkraineUnited Arab EmiratesUnited KingdomUnited StatesUpper middle incomeUruguayVenezuela, RBVietnamWorldYemen, Rep.ZambiaZimbabwe Timeline:
This timeline shows a graph from 1961 to 2015 of Post-demographic dividend. No data until 1960. Number of actual observations by date: 55.
Source name:
World Development Indicators
Source organization:
World Bank staff estimates based data from International Monetary Fund's Direction of Trade database.
Categories, topics:
Private Sector, Trade
Last updated:
apr 23, 2017
Indicators value changes by year
Maximum:
13.344
jan 1, 1981
At the date of observation
Value
Absolute change
Change from previous value
jan 1, 1961
5.354
+5.354
0.0%
jan 1, 1962
5.265
-0.089
-1.67%
jan 1, 1963
5.274
+0.009
0.18%
jan 1, 1964
5.344
+0.07
1.33%
jan 1, 1965
5.31
-0.034
-0.64%
jan 1, 1966
5.163
-0.147
-2.77%
jan 1, 1967
4.903
-0.26
-5.04%
jan 1, 1968
4.965
+0.063
1.28%
jan 1, 1969
5.35
+0.385
7.74%
jan 1, 1970
4.942
-0.408
-7.62%
jan 1, 1971
4.708
-0.234
-4.73%
jan 1, 1972
5.193
+0.485
10.3%
jan 1, 1973
4.977
-0.216
-4.15%
jan 1, 1974
5.239
+0.262
5.27%
jan 1, 1975
9.697
+4.458
85.08%
jan 1, 1976
9.834
+0.138
1.42%
jan 1, 1977
10.673
+0.839
8.53%
jan 1, 1978
10.647
-0.026
-0.25%
jan 1, 1979
9.221
-1.426
-13.39%
jan 1, 1980
10.747
+1.526
16.55%
jan 1, 1981
13.344
+2.598
24.17%
jan 1, 1982
13.153
-0.191
-1.43%
jan 1, 1983
10.37
-2.783
-21.16%
jan 1, 1984
8.082
-2.289
-22.07%
jan 1, 1985
7.012
-1.069
-13.23%
jan 1, 1986
6.012
-1.001
-14.27%
jan 1, 1987
3.966
-2.046
-34.04%
jan 1, 1988
3.845
-0.121
-3.04%
jan 1, 1989
3.29
-0.555
-14.44%
jan 1, 1990
3.628
+0.338
10.26%
jan 1, 1991
4.192
+0.565
15.57%
jan 1, 1992
3.853
-0.339
-8.09%
jan 1, 1993
3.638
-0.215
-5.58%
jan 1, 1994
3.531
-0.107
-2.95%
jan 1, 1995
3.079
-0.451
-12.79%
jan 1, 1996
2.903
-0.176
-5.71%
jan 1, 1997
3.186
+0.283
9.74%
jan 1, 1998
3.23
+0.044
1.38%
jan 1, 1999
2.456
-0.774
-23.98%
jan 1, 2000
2.714
+0.259
10.53%
jan 1, 2001
3.742
+1.028
37.87%
jan 1, 2002
3.596
-0.147
-3.92%
jan 1, 2003
3.303
-0.293
-8.15%
jan 1, 2004
3.541
+0.238
7.21%
jan 1, 2005
3.782
+0.241
6.8%
jan 1, 2006
4.608
+0.826
21.85%
jan 1, 2007
4.909
+0.301
6.53%
jan 1, 2008
4.646
-0.263
-5.36%
jan 1, 2009
5.859
+1.213
26.11%
jan 1, 2010
4.357
-1.502
-25.63%
jan 1, 2011
4.644
+0.287
6.58%
jan 1, 2012
5.377
+0.733
15.78%
jan 1, 2013
6.06
+0.684
12.72%
jan 1, 2014
5.73
-0.33
-5.45%
jan 1, 2015
5.187
-0.543
-9.48%
Ranking of countries by current statistics by years


Comments: