29
/
en
AIzaSyAYiBZKx7MnpbEhh9jyipgxe19OcubqV5w
April 1, 2024
106246
China
CHN
true
2
1
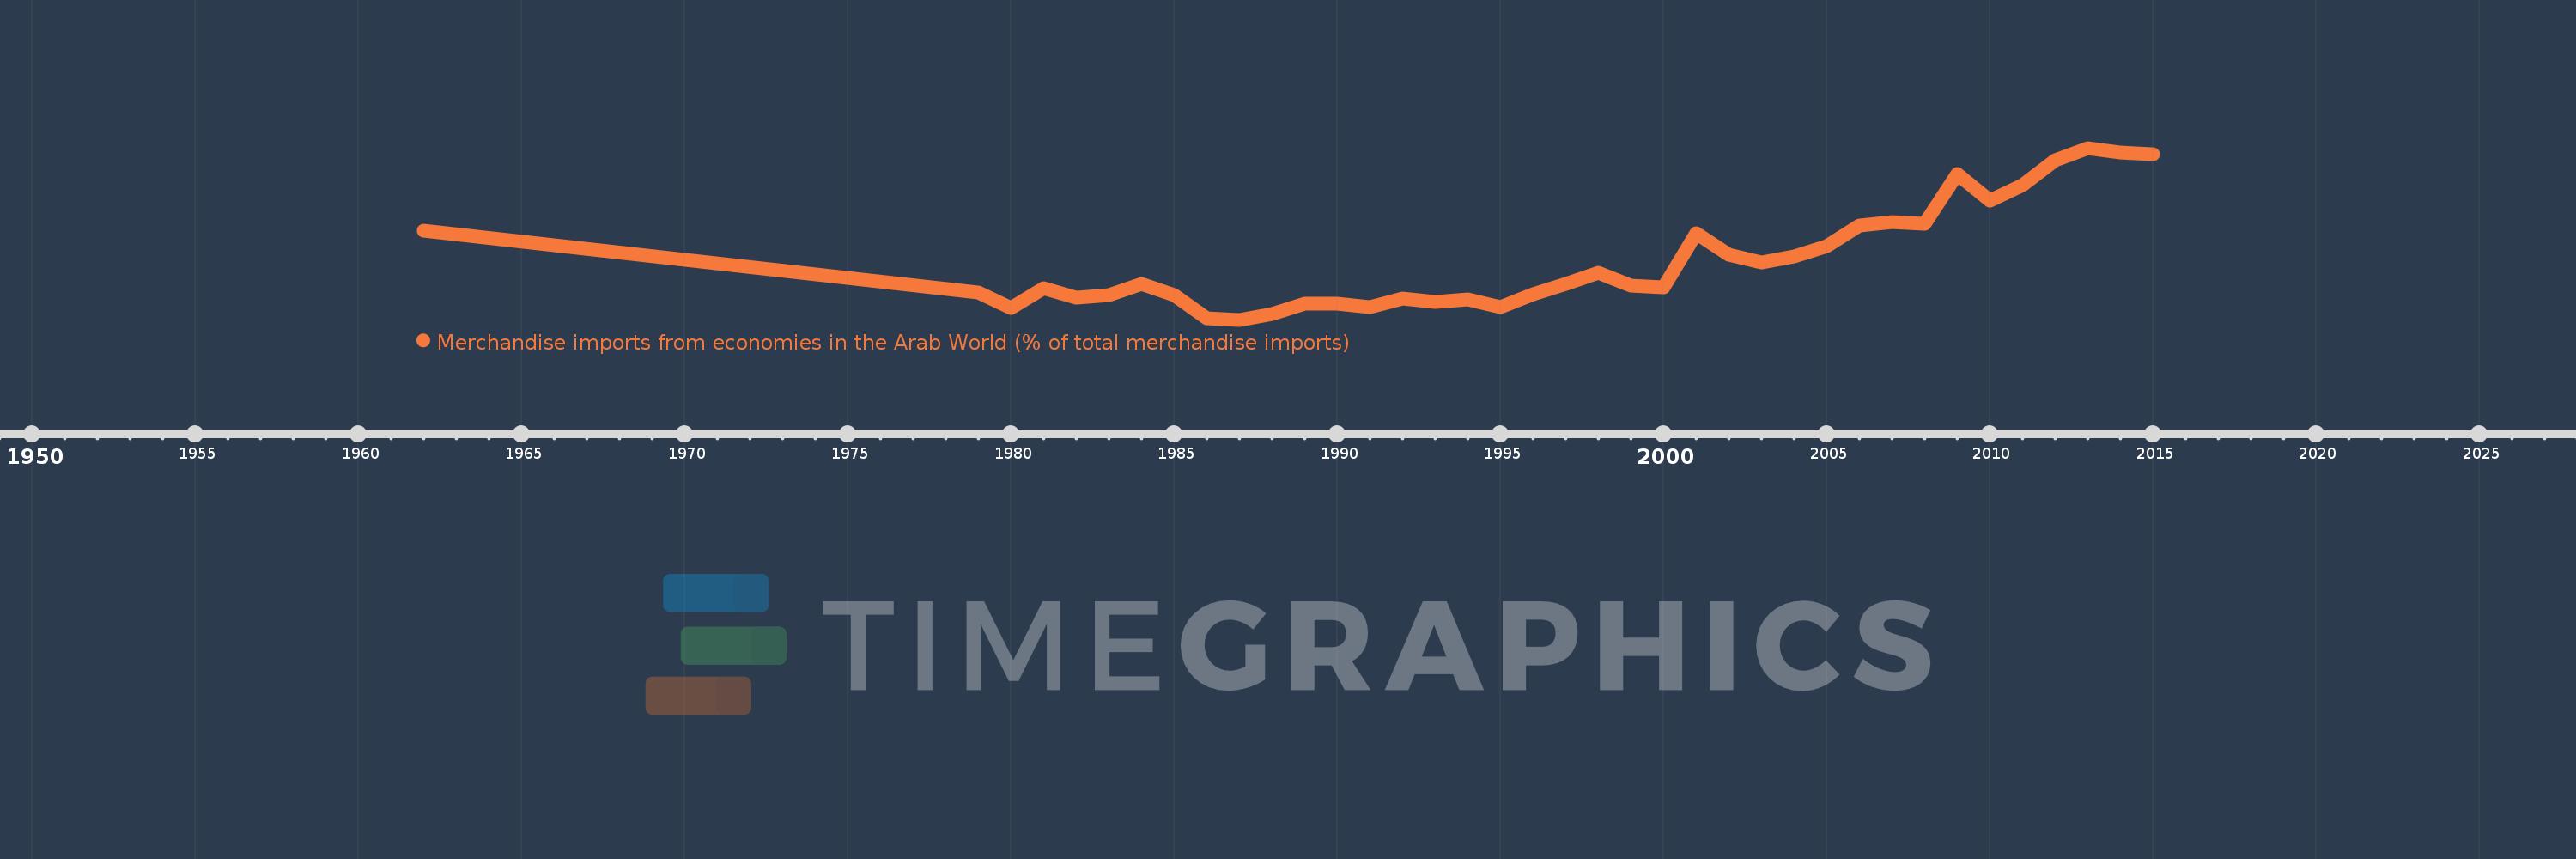
Merchandise imports from economies in the Arab World (% of total merchandise imports)
2015,2014,2013,2012,2011,2010,2009,2008,2007,2006,2005,2004,2003,2002,2001,2000,1999,1998,1997,1996,1995,1994,1993,1992,1991,1990,1989,1988,1987,1986,1985,1984,1983,1982,1981,1980,1979,1962
This statistics in other country:
AfghanistanAlbaniaAlgeriaAngolaArab WorldArgentinaArmeniaArubaAustraliaAustriaAzerbaijanBahamas, TheBahrainBangladeshBarbadosBelarusBelgiumBelizeBeninBermudaBoliviaBrazilBrunei DarussalamBulgariaBurkina FasoBurundiCabo VerdeCambodiaCameroonCanadaCaribbean small statesCentral African RepublicCentral Europe and the BalticsChadChileChinaColombiaComorosCongo, Dem. Rep.Congo, Rep.Costa RicaCote d'IvoireCroatiaCubaCyprusCzech RepublicDenmarkDjiboutiDominicaDominican RepublicEarly-demographic dividendEast Asia & PacificEast Asia & Pacific (excluding high income)East Asia & Pacific (IDA & IBRD countries)EcuadorEgypt, Arab Rep.El SalvadorEstoniaEthiopiaEuro areaEurope & Central AsiaEurope & Central Asia (excluding high income)Europe & Central Asia (IDA & IBRD countries)European UnionFijiFinlandFragile and conflict affected situationsFranceFrench PolynesiaGabonGambia, TheGeorgiaGermanyGhanaGreeceGreenlandGrenadaGuatemalaGuineaGuinea-BissauGuyanaHaitiHeavily indebted poor countries (HIPC)High incomeHondurasHong Kong SAR, ChinaHungaryIBRD onlyIcelandIDA & IBRD totalIDA blendIDA onlyIDA totalIndiaIndonesiaIran, Islamic Rep.IraqIrelandItalyJamaicaJapanJordanKazakhstanKenyaKorea, Dem. People’s Rep.Korea, Rep.KuwaitKyrgyz RepublicLao PDRLate-demographic dividendLatin America & Caribbean Latin America & Caribbean (excluding high income)Latin America & the Caribbean (IDA & IBRD countries)LatviaLeast developed countries: UN classificationLebanonLiberiaLibyaLithuaniaLow & middle incomeLow incomeLower middle incomeLuxembourgMacao SAR, ChinaMacedonia, FYRMadagascarMalawiMalaysiaMaldivesMaliMaltaMauritaniaMauritiusMexicoMiddle East & North AfricaMiddle East & North Africa (excluding high income)Middle East & North Africa (IDA & IBRD countries)Middle incomeMoldovaMongoliaMontenegroMoroccoMozambiqueMyanmarNepalNetherlandsNew CaledoniaNew ZealandNicaraguaNigerNigeriaNorth AmericaNorwayOECD membersOmanOther small statesPacific island small statesPakistanPanamaPapua New GuineaParaguayPeruPhilippinesPolandPortugalPost-demographic dividendPre-demographic dividendQatarRomaniaRussian FederationRwandaSaudi ArabiaSenegalSerbiaSeychellesSierra LeoneSingaporeSlovak RepublicSloveniaSmall statesSomaliaSouth AfricaSouth AsiaSouth Asia (IDA & IBRD)SpainSri LankaSt. LuciaSt. Vincent and the GrenadinesSub-Saharan Africa Sub-Saharan Africa (excluding high income)Sub-Saharan Africa (IDA & IBRD countries)SudanSurinameSwedenSwitzerlandSyrian Arab RepublicTajikistanTanzaniaThailandTogoTrinidad and TobagoTunisiaTurkeyTurkmenistanUgandaUkraineUnited Arab EmiratesUnited KingdomUnited StatesUpper middle incomeUruguayVenezuela, RBVietnamWorldYemen, Rep.ZambiaZimbabwe Timeline:
This timeline shows a graph from 1962 to 2015 of China. No data until 1961. Number of actual observations by date: 38.
Source name:
World Development Indicators
Source organization:
World Bank staff estimates based data from International Monetary Fund's Direction of Trade database.
Categories, topics:
Private Sector, Trade
Last updated:
apr 23, 2017
Indicators value changes by year
At the date of observation
Value
Absolute change
Change from previous value
jan 1, 1962
4.005
+4.005
0.0%
jan 1, 1979
1.581
-2.424
-60.52%
jan 1, 1980
0.99
-0.591
-37.38%
jan 1, 1981
1.771
+0.781
78.87%
jan 1, 1982
1.368
-0.403
-22.77%
jan 1, 1983
1.502
+0.134
9.78%
jan 1, 1984
1.928
+0.426
28.38%
jan 1, 1985
1.477
-0.451
-23.4%
jan 1, 1986
0.569
-0.908
-61.51%
jan 1, 1987
0.521
-0.047
-8.34%
jan 1, 1988
0.757
+0.235
45.19%
jan 1, 1989
1.159
+0.403
53.26%
jan 1, 1990
1.142
-0.018
-1.54%
jan 1, 1991
1.021
-0.121
-10.61%
jan 1, 1992
1.363
+0.343
33.57%
jan 1, 1993
1.202
-0.161
-11.85%
jan 1, 1994
1.308
+0.106
8.85%
jan 1, 1995
1.001
-0.307
-23.48%
jan 1, 1996
1.526
+0.525
52.5%
jan 1, 1997
1.917
+0.39
25.58%
jan 1, 1998
2.35
+0.433
22.59%
jan 1, 1999
1.855
-0.494
-21.03%
jan 1, 2000
1.783
-0.073
-3.92%
jan 1, 2001
3.916
+2.133
119.66%
jan 1, 2002
3.08
-0.836
-21.36%
jan 1, 2003
2.748
-0.332
-10.77%
jan 1, 2004
2.998
+0.25
9.11%
jan 1, 2005
3.402
+0.404
13.48%
jan 1, 2006
4.2
+0.798
23.44%
jan 1, 2007
4.341
+0.14
3.34%
jan 1, 2008
4.279
-0.062
-1.43%
jan 1, 2009
6.212
+1.934
45.19%
jan 1, 2010
5.187
-1.025
-16.5%
jan 1, 2011
5.771
+0.584
11.25%
jan 1, 2012
6.775
+1.005
17.41%
jan 1, 2013
7.243
+0.467
6.9%
jan 1, 2014
7.05
-0.193
-2.66%
jan 1, 2015
6.991
-0.059
-0.84%
Ranking of countries by current statistics by years


Comments: