29
/
en
AIzaSyAYiBZKx7MnpbEhh9jyipgxe19OcubqV5w
April 1, 2024
203201
Mozambique
MOZ
true
2
1
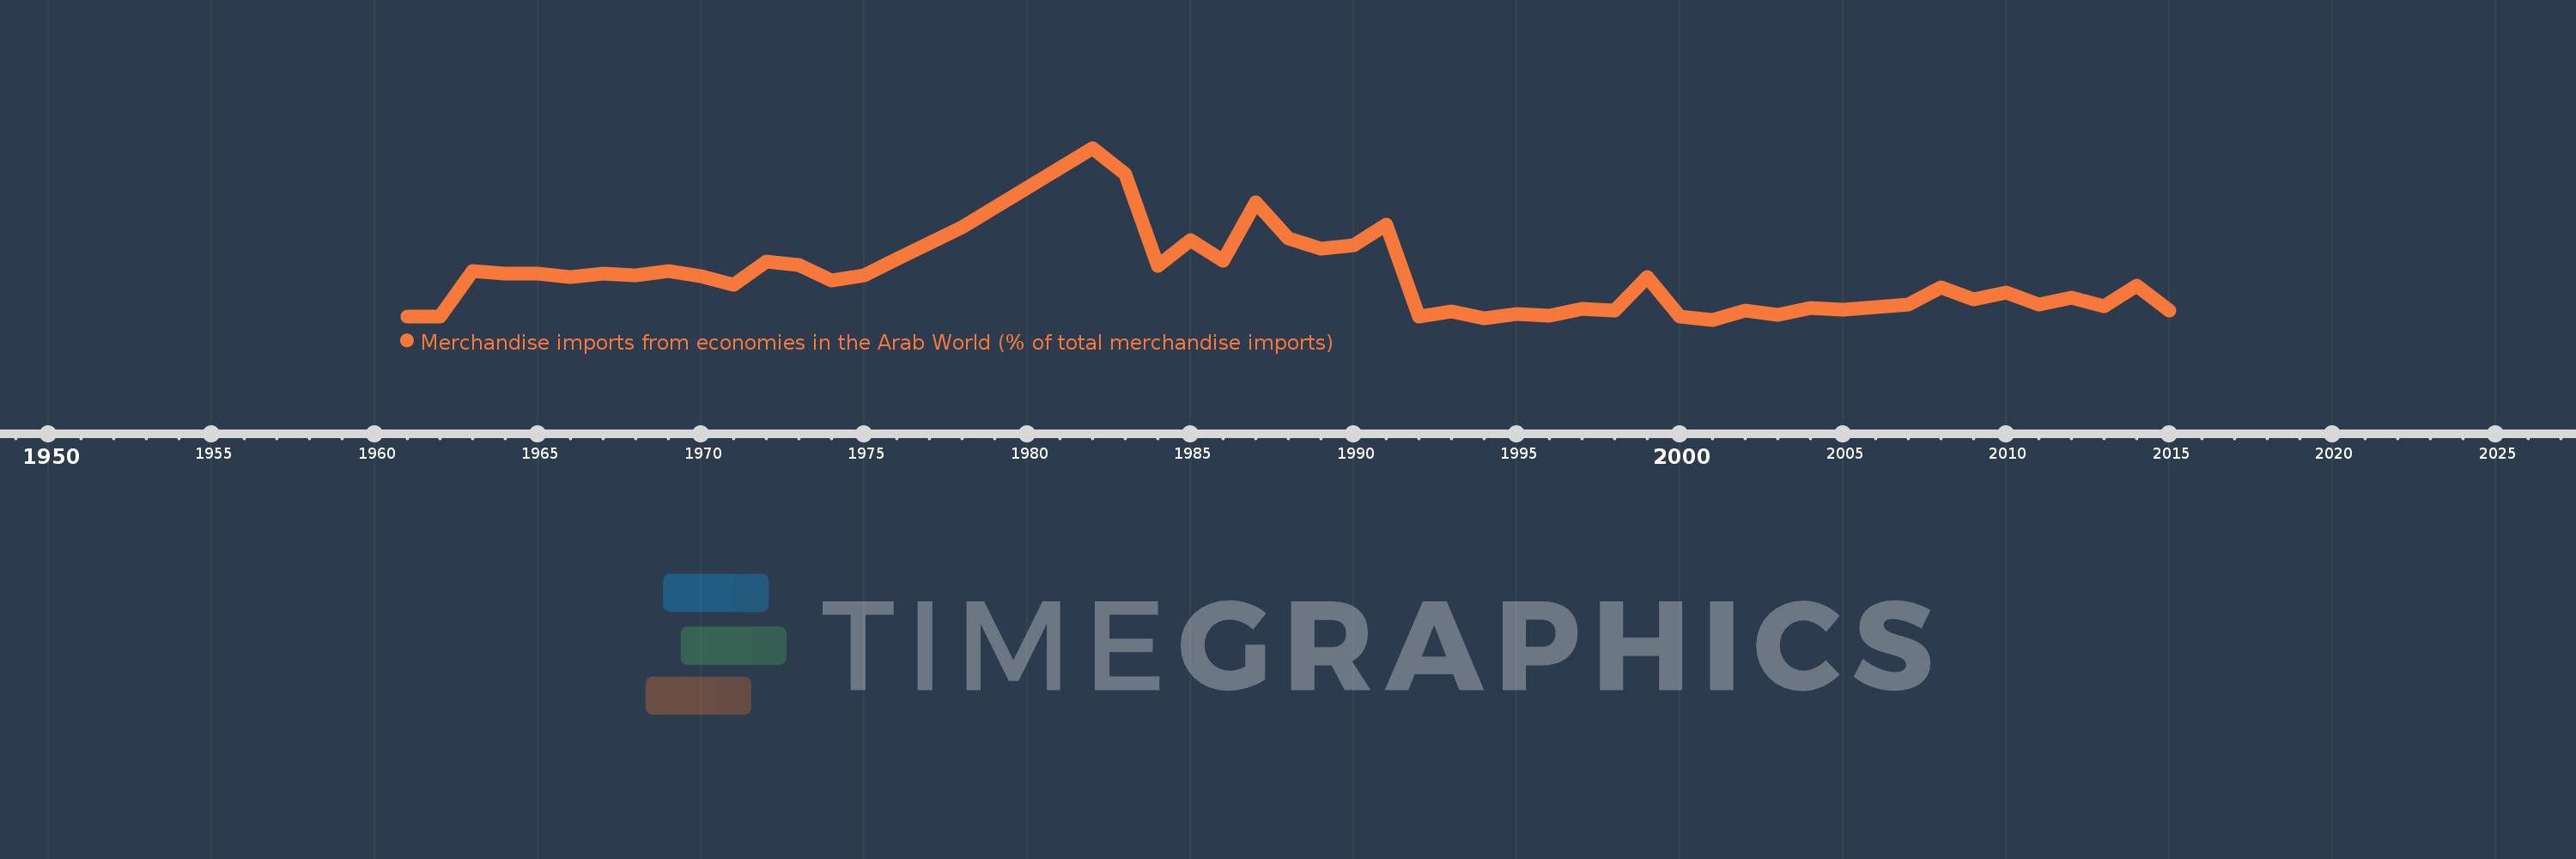
Merchandise imports from economies in the Arab World (% of total merchandise imports)
2015,2014,2013,2012,2011,2010,2009,2008,2007,2006,2005,2004,2003,2002,2001,2000,1999,1998,1997,1996,1995,1994,1993,1992,1991,1990,1989,1988,1987,1986,1985,1984,1983,1982,1978,1976,1975,1974,1973,1972,1971,1970,1969,1968,1967,1966,1965,1964,1963,1962,1961
This statistics in other country:
AfghanistanAlbaniaAlgeriaAngolaArab WorldArgentinaArmeniaArubaAustraliaAustriaAzerbaijanBahamas, TheBahrainBangladeshBarbadosBelarusBelgiumBelizeBeninBermudaBoliviaBrazilBrunei DarussalamBulgariaBurkina FasoBurundiCabo VerdeCambodiaCameroonCanadaCaribbean small statesCentral African RepublicCentral Europe and the BalticsChadChileChinaColombiaComorosCongo, Dem. Rep.Congo, Rep.Costa RicaCote d'IvoireCroatiaCubaCyprusCzech RepublicDenmarkDjiboutiDominicaDominican RepublicEarly-demographic dividendEast Asia & PacificEast Asia & Pacific (excluding high income)East Asia & Pacific (IDA & IBRD countries)EcuadorEgypt, Arab Rep.El SalvadorEstoniaEthiopiaEuro areaEurope & Central AsiaEurope & Central Asia (excluding high income)Europe & Central Asia (IDA & IBRD countries)European UnionFijiFinlandFragile and conflict affected situationsFranceFrench PolynesiaGabonGambia, TheGeorgiaGermanyGhanaGreeceGreenlandGrenadaGuatemalaGuineaGuinea-BissauGuyanaHaitiHeavily indebted poor countries (HIPC)High incomeHondurasHong Kong SAR, ChinaHungaryIBRD onlyIcelandIDA & IBRD totalIDA blendIDA onlyIDA totalIndiaIndonesiaIran, Islamic Rep.IraqIrelandItalyJamaicaJapanJordanKazakhstanKenyaKorea, Dem. People’s Rep.Korea, Rep.KuwaitKyrgyz RepublicLao PDRLate-demographic dividendLatin America & Caribbean Latin America & Caribbean (excluding high income)Latin America & the Caribbean (IDA & IBRD countries)LatviaLeast developed countries: UN classificationLebanonLiberiaLibyaLithuaniaLow & middle incomeLow incomeLower middle incomeLuxembourgMacao SAR, ChinaMacedonia, FYRMadagascarMalawiMalaysiaMaldivesMaliMaltaMauritaniaMauritiusMexicoMiddle East & North AfricaMiddle East & North Africa (excluding high income)Middle East & North Africa (IDA & IBRD countries)Middle incomeMoldovaMongoliaMontenegroMoroccoMozambiqueMyanmarNepalNetherlandsNew CaledoniaNew ZealandNicaraguaNigerNigeriaNorth AmericaNorwayOECD membersOmanOther small statesPacific island small statesPakistanPanamaPapua New GuineaParaguayPeruPhilippinesPolandPortugalPost-demographic dividendPre-demographic dividendQatarRomaniaRussian FederationRwandaSaudi ArabiaSenegalSerbiaSeychellesSierra LeoneSingaporeSlovak RepublicSloveniaSmall statesSomaliaSouth AfricaSouth AsiaSouth Asia (IDA & IBRD)SpainSri LankaSt. LuciaSt. Vincent and the GrenadinesSub-Saharan Africa Sub-Saharan Africa (excluding high income)Sub-Saharan Africa (IDA & IBRD countries)SudanSurinameSwedenSwitzerlandSyrian Arab RepublicTajikistanTanzaniaThailandTogoTrinidad and TobagoTunisiaTurkeyTurkmenistanUgandaUkraineUnited Arab EmiratesUnited KingdomUnited StatesUpper middle incomeUruguayVenezuela, RBVietnamWorldYemen, Rep.ZambiaZimbabwe Timeline:
This timeline shows a graph from 1961 to 2015 of Mozambique. No data until 1960. Number of actual observations by date: 51.
Source name:
World Development Indicators
Source organization:
World Bank staff estimates based data from International Monetary Fund's Direction of Trade database.
Categories, topics:
Private Sector, Trade
Last updated:
apr 23, 2017
Indicators value changes by year
Maximum:
20.731
jan 1, 1982
At the date of observation
Value
Absolute change
Change from previous value
jan 1, 1961
0.646
+0.646
0.0%
jan 1, 1962
0.634
-0.011
-1.74%
jan 1, 1963
6.049
+5.415
853.47%
jan 1, 1964
5.793
-0.256
-4.23%
jan 1, 1965
5.784
-0.009
-0.15%
jan 1, 1966
5.385
-0.399
-6.9%
jan 1, 1967
5.71
+0.325
6.04%
jan 1, 1968
5.536
-0.174
-3.05%
jan 1, 1969
6.009
+0.472
8.53%
jan 1, 1970
5.432
-0.577
-9.6%
jan 1, 1971
4.408
-1.023
-18.84%
jan 1, 1972
7.197
+2.788
63.25%
jan 1, 1973
6.733
-0.464
-6.45%
jan 1, 1974
4.951
-1.782
-26.47%
jan 1, 1975
5.557
+0.606
12.24%
jan 1, 1976
7.523
+1.966
35.38%
jan 1, 1978
11.246
+3.724
49.5%
jan 1, 1982
20.731
+9.484
84.33%
jan 1, 1983
17.658
-3.072
-14.82%
jan 1, 1984
6.634
-11.024
-62.43%
jan 1, 1985
9.752
+3.118
46.99%
jan 1, 1986
7.318
-2.434
-24.96%
jan 1, 1987
14.26
+6.942
94.86%
jan 1, 1988
9.911
-4.349
-30.5%
jan 1, 1989
8.737
-1.174
-11.84%
jan 1, 1990
9.118
+0.381
4.36%
jan 1, 1991
11.588
+2.47
27.09%
jan 1, 1992
0.621
-10.967
-94.64%
jan 1, 1993
1.289
+0.668
107.65%
jan 1, 1994
0.438
-0.851
-65.99%
jan 1, 1995
0.967
+0.529
120.62%
jan 1, 1996
0.701
-0.266
-27.53%
jan 1, 1997
1.549
+0.848
120.99%
jan 1, 1998
1.35
-0.199
-12.82%
jan 1, 1999
5.358
+4.008
296.9%
jan 1, 2000
0.592
-4.767
-88.96%
jan 1, 2001
0.25
-0.341
-57.68%
jan 1, 2002
1.337
+1.086
433.77%
jan 1, 2003
0.879
-0.458
-34.27%
jan 1, 2004
1.641
+0.762
86.78%
jan 1, 2005
1.47
-0.171
-10.44%
jan 1, 2006
1.793
+0.324
22.02%
jan 1, 2007
2.1
+0.306
17.08%
jan 1, 2008
4.149
+2.049
97.59%
jan 1, 2009
2.681
-1.468
-35.38%
jan 1, 2010
3.479
+0.798
29.79%
jan 1, 2011
2.094
-1.385
-39.8%
jan 1, 2012
2.835
+0.74
35.35%
jan 1, 2013
1.859
-0.976
-34.42%
jan 1, 2014
4.345
+2.486
133.71%
jan 1, 2015
1.359
-2.985
-68.71%
Ranking of countries by current statistics by years


Comments: