29
/
en
AIzaSyAYiBZKx7MnpbEhh9jyipgxe19OcubqV5w
April 1, 2024
56403
Small states
SST
false
2
1
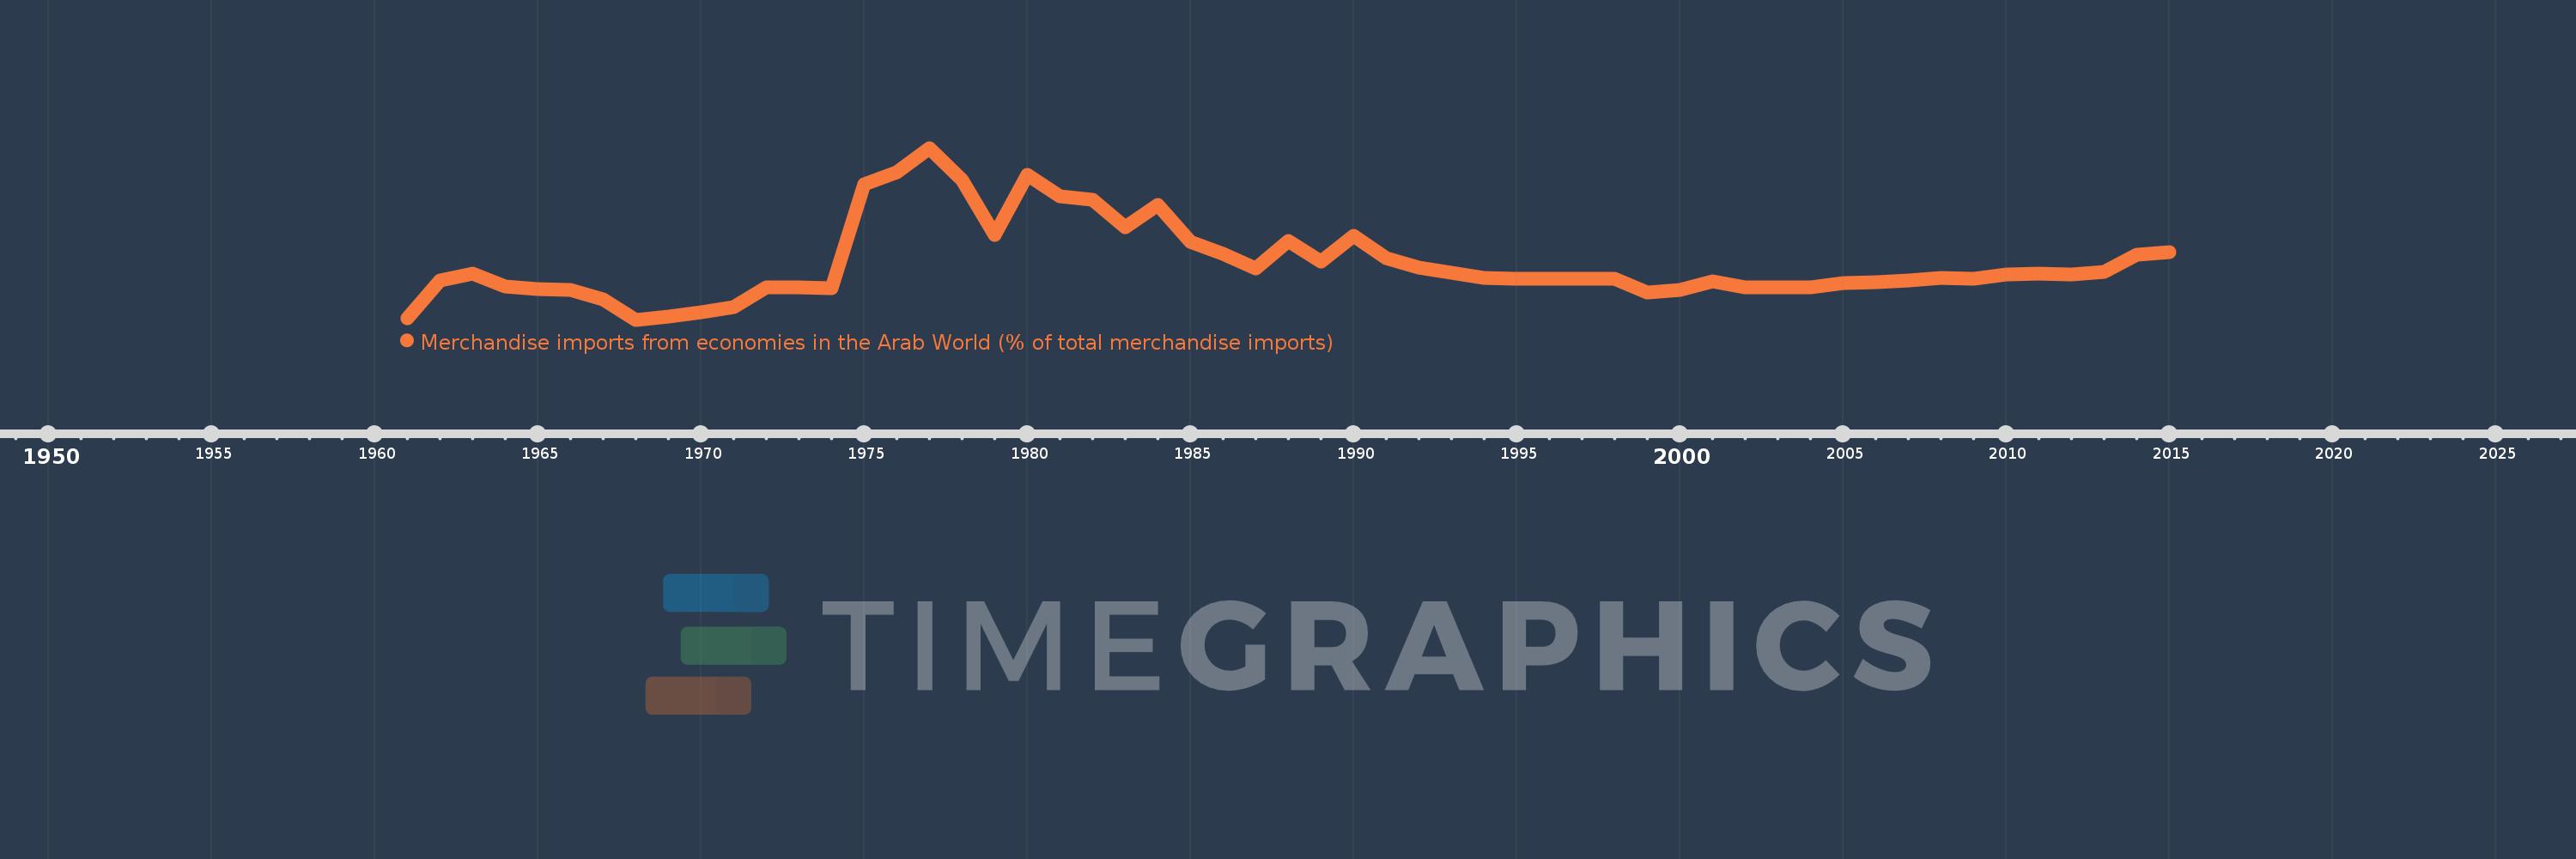
Merchandise imports from economies in the Arab World (% of total merchandise imports)
2015,2014,2013,2012,2011,2010,2009,2008,2007,2006,2005,2004,2003,2002,2001,2000,1999,1998,1997,1996,1995,1994,1993,1992,1991,1990,1989,1988,1987,1986,1985,1984,1983,1982,1981,1980,1979,1978,1977,1976,1975,1974,1973,1972,1971,1970,1969,1968,1967,1966,1965,1964,1963,1962,1961
This statistics in other country:
AfghanistanAlbaniaAlgeriaAngolaArab WorldArgentinaArmeniaArubaAustraliaAustriaAzerbaijanBahamas, TheBahrainBangladeshBarbadosBelarusBelgiumBelizeBeninBermudaBoliviaBrazilBrunei DarussalamBulgariaBurkina FasoBurundiCabo VerdeCambodiaCameroonCanadaCaribbean small statesCentral African RepublicCentral Europe and the BalticsChadChileChinaColombiaComorosCongo, Dem. Rep.Congo, Rep.Costa RicaCote d'IvoireCroatiaCubaCyprusCzech RepublicDenmarkDjiboutiDominicaDominican RepublicEarly-demographic dividendEast Asia & PacificEast Asia & Pacific (excluding high income)East Asia & Pacific (IDA & IBRD countries)EcuadorEgypt, Arab Rep.El SalvadorEstoniaEthiopiaEuro areaEurope & Central AsiaEurope & Central Asia (excluding high income)Europe & Central Asia (IDA & IBRD countries)European UnionFijiFinlandFragile and conflict affected situationsFranceFrench PolynesiaGabonGambia, TheGeorgiaGermanyGhanaGreeceGreenlandGrenadaGuatemalaGuineaGuinea-BissauGuyanaHaitiHeavily indebted poor countries (HIPC)High incomeHondurasHong Kong SAR, ChinaHungaryIBRD onlyIcelandIDA & IBRD totalIDA blendIDA onlyIDA totalIndiaIndonesiaIran, Islamic Rep.IraqIrelandItalyJamaicaJapanJordanKazakhstanKenyaKorea, Dem. People’s Rep.Korea, Rep.KuwaitKyrgyz RepublicLao PDRLate-demographic dividendLatin America & Caribbean Latin America & Caribbean (excluding high income)Latin America & the Caribbean (IDA & IBRD countries)LatviaLeast developed countries: UN classificationLebanonLiberiaLibyaLithuaniaLow & middle incomeLow incomeLower middle incomeLuxembourgMacao SAR, ChinaMacedonia, FYRMadagascarMalawiMalaysiaMaldivesMaliMaltaMauritaniaMauritiusMexicoMiddle East & North AfricaMiddle East & North Africa (excluding high income)Middle East & North Africa (IDA & IBRD countries)Middle incomeMoldovaMongoliaMontenegroMoroccoMozambiqueMyanmarNepalNetherlandsNew CaledoniaNew ZealandNicaraguaNigerNigeriaNorth AmericaNorwayOECD membersOmanOther small statesPacific island small statesPakistanPanamaPapua New GuineaParaguayPeruPhilippinesPolandPortugalPost-demographic dividendPre-demographic dividendQatarRomaniaRussian FederationRwandaSaudi ArabiaSenegalSerbiaSeychellesSierra LeoneSingaporeSlovak RepublicSloveniaSmall statesSomaliaSouth AfricaSouth AsiaSouth Asia (IDA & IBRD)SpainSri LankaSt. LuciaSt. Vincent and the GrenadinesSub-Saharan Africa Sub-Saharan Africa (excluding high income)Sub-Saharan Africa (IDA & IBRD countries)SudanSurinameSwedenSwitzerlandSyrian Arab RepublicTajikistanTanzaniaThailandTogoTrinidad and TobagoTunisiaTurkeyTurkmenistanUgandaUkraineUnited Arab EmiratesUnited KingdomUnited StatesUpper middle incomeUruguayVenezuela, RBVietnamWorldYemen, Rep.ZambiaZimbabwe Timeline:
This timeline shows a graph from 1961 to 2015 of Small states. No data until 1960. Number of actual observations by date: 55.
Source name:
World Development Indicators
Source organization:
World Bank staff estimates based data from International Monetary Fund's Direction of Trade database.
Categories, topics:
Private Sector, Trade
Last updated:
apr 23, 2017
Indicators value changes by year
Maximum:
27.229
jan 1, 1977
At the date of observation
Value
Absolute change
Change from previous value
jan 1, 1961
0.637
+0.637
0.0%
jan 1, 1962
6.567
+5.93
931.29%
jan 1, 1963
7.67
+1.103
16.8%
jan 1, 1964
5.637
-2.033
-26.51%
jan 1, 1965
5.268
-0.369
-6.54%
jan 1, 1966
5.08
-0.188
-3.57%
jan 1, 1967
3.59
-1.49
-29.33%
jan 1, 1968
0.456
-3.134
-87.29%
jan 1, 1969
0.914
+0.458
100.31%
jan 1, 1970
1.582
+0.668
73.04%
jan 1, 1971
2.453
+0.871
55.02%
jan 1, 1972
5.559
+3.106
126.65%
jan 1, 1973
5.478
-0.081
-1.46%
jan 1, 1974
5.327
-0.151
-2.75%
jan 1, 1975
21.574
+16.247
304.99%
jan 1, 1976
23.376
+1.802
8.35%
jan 1, 1977
27.229
+3.854
16.49%
jan 1, 1978
22.177
-5.052
-18.55%
jan 1, 1979
13.618
-8.56
-38.6%
jan 1, 1980
22.998
+9.38
68.88%
jan 1, 1981
19.692
-3.306
-14.38%
jan 1, 1982
19.212
-0.48
-2.44%
jan 1, 1983
14.836
-4.377
-22.78%
jan 1, 1984
18.357
+3.522
23.74%
jan 1, 1985
12.587
-5.77
-31.43%
jan 1, 1986
10.743
-1.845
-14.65%
jan 1, 1987
8.501
-2.242
-20.87%
jan 1, 1988
12.77
+4.269
50.22%
jan 1, 1989
9.528
-3.242
-25.39%
jan 1, 1990
13.496
+3.968
41.65%
jan 1, 1991
10.019
-3.478
-25.77%
jan 1, 1992
8.593
-1.426
-14.23%
jan 1, 1993
7.819
-0.774
-9.01%
jan 1, 1994
6.949
-0.87
-11.12%
jan 1, 1995
6.852
-0.097
-1.39%
jan 1, 1996
6.87
+0.018
0.27%
jan 1, 1997
6.781
-0.089
-1.3%
jan 1, 1998
6.808
+0.026
0.39%
jan 1, 1999
4.719
-2.088
-30.68%
jan 1, 2000
5.044
+0.325
6.89%
jan 1, 2001
6.441
+1.397
27.69%
jan 1, 2002
5.488
-0.953
-14.8%
jan 1, 2003
5.503
+0.014
0.26%
jan 1, 2004
5.535
+0.032
0.59%
jan 1, 2005
6.149
+0.614
11.09%
jan 1, 2006
6.276
+0.127
2.06%
jan 1, 2007
6.578
+0.303
4.82%
jan 1, 2008
6.922
+0.343
5.22%
jan 1, 2009
6.857
-0.065
-0.94%
jan 1, 2010
7.505
+0.648
9.45%
jan 1, 2011
7.625
+0.12
1.6%
jan 1, 2012
7.469
-0.156
-2.05%
jan 1, 2013
7.933
+0.464
6.21%
jan 1, 2014
10.583
+2.65
33.41%
jan 1, 2015
11.022
+0.439
4.15%
Ranking of countries by current statistics by years


Comments: