29
/
en
AIzaSyAYiBZKx7MnpbEhh9jyipgxe19OcubqV5w
April 1, 2024
76411
Bahamas, The
BHS
true
2
1
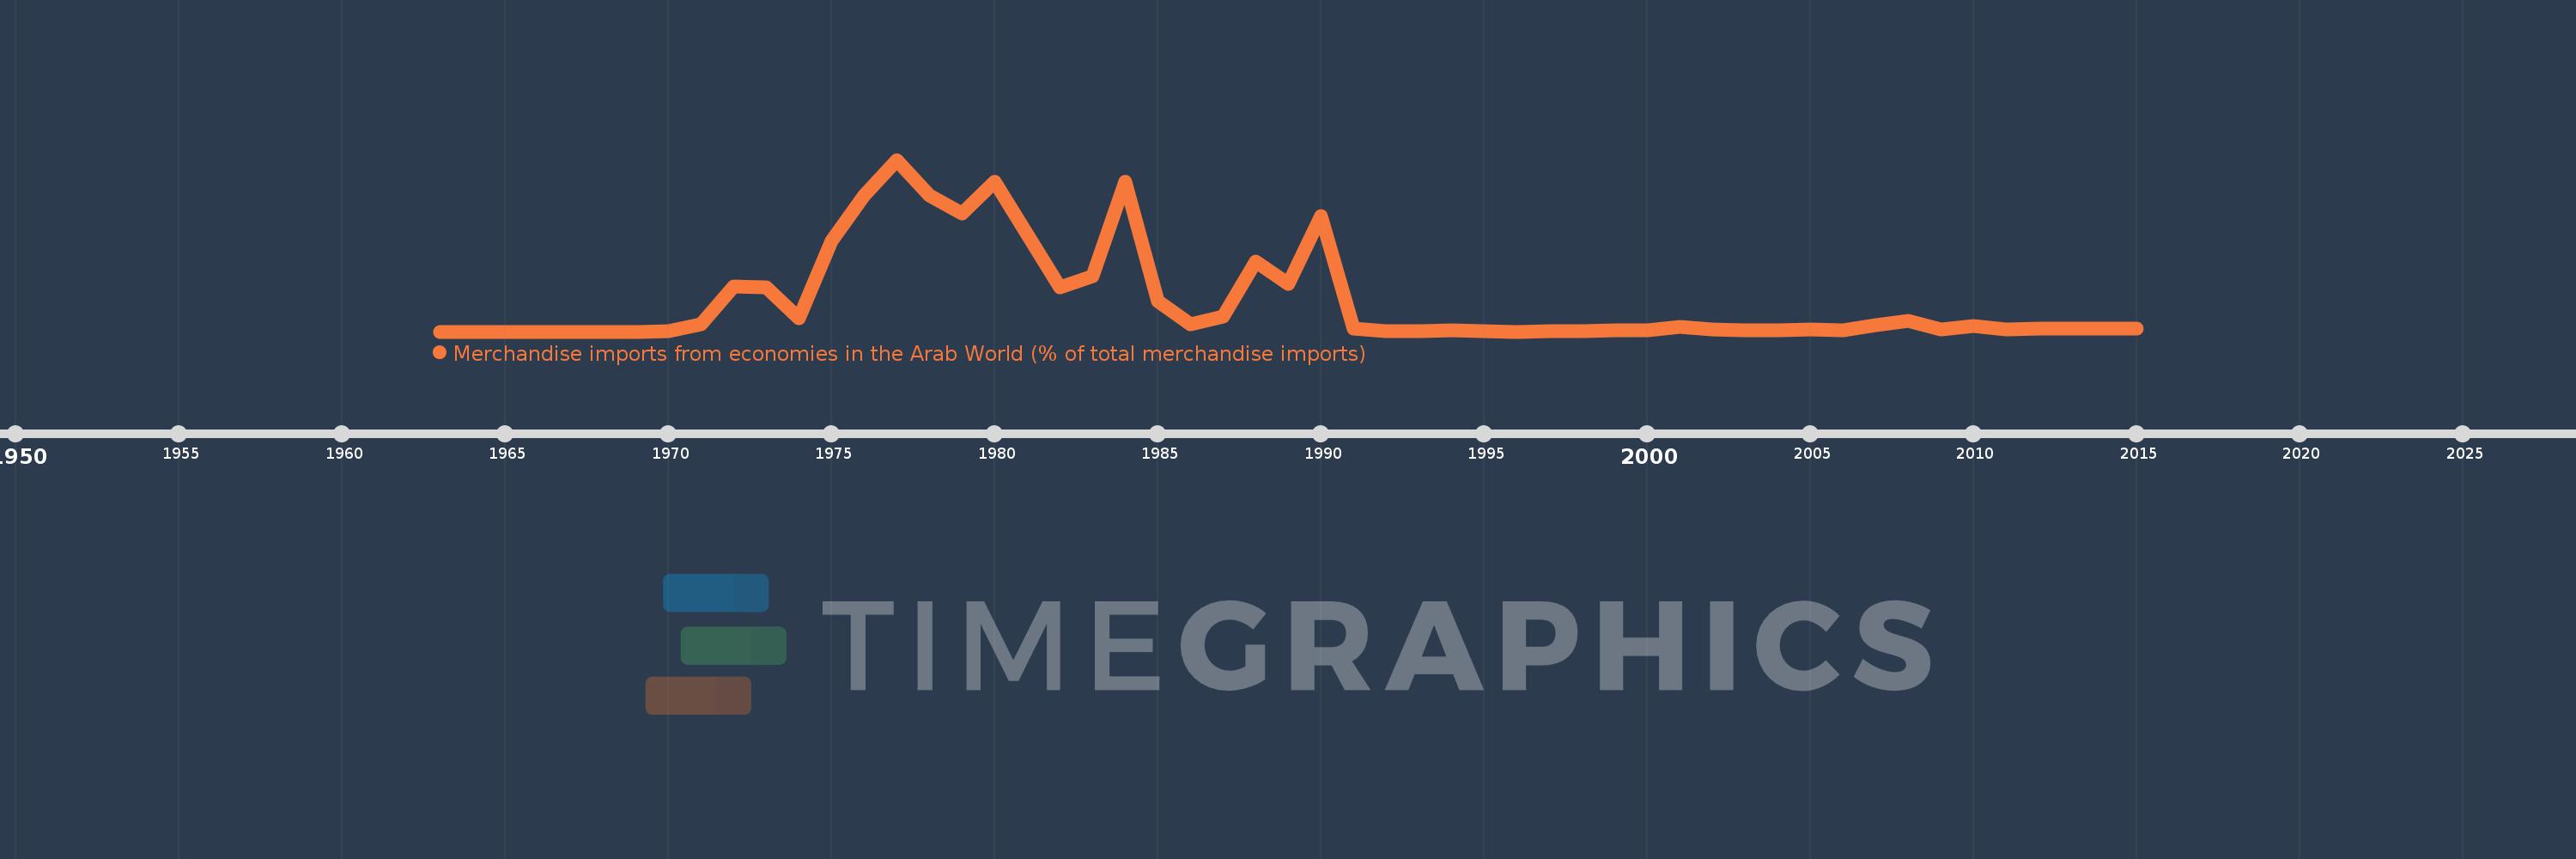
Merchandise imports from economies in the Arab World (% of total merchandise imports)
2015,2014,2013,2012,2011,2010,2009,2008,2007,2006,2005,2004,2003,2002,2001,2000,1999,1998,1997,1996,1995,1994,1993,1992,1991,1990,1989,1988,1987,1986,1985,1984,1983,1982,1980,1979,1978,1977,1976,1975,1974,1973,1972,1971,1970,1969,1968,1967,1965,1964,1963
This statistics in other country:
AfghanistanAlbaniaAlgeriaAngolaArab WorldArgentinaArmeniaArubaAustraliaAustriaAzerbaijanBahamas, TheBahrainBangladeshBarbadosBelarusBelgiumBelizeBeninBermudaBoliviaBrazilBrunei DarussalamBulgariaBurkina FasoBurundiCabo VerdeCambodiaCameroonCanadaCaribbean small statesCentral African RepublicCentral Europe and the BalticsChadChileChinaColombiaComorosCongo, Dem. Rep.Congo, Rep.Costa RicaCote d'IvoireCroatiaCubaCyprusCzech RepublicDenmarkDjiboutiDominicaDominican RepublicEarly-demographic dividendEast Asia & PacificEast Asia & Pacific (excluding high income)East Asia & Pacific (IDA & IBRD countries)EcuadorEgypt, Arab Rep.El SalvadorEstoniaEthiopiaEuro areaEurope & Central AsiaEurope & Central Asia (excluding high income)Europe & Central Asia (IDA & IBRD countries)European UnionFijiFinlandFragile and conflict affected situationsFranceFrench PolynesiaGabonGambia, TheGeorgiaGermanyGhanaGreeceGreenlandGrenadaGuatemalaGuineaGuinea-BissauGuyanaHaitiHeavily indebted poor countries (HIPC)High incomeHondurasHong Kong SAR, ChinaHungaryIBRD onlyIcelandIDA & IBRD totalIDA blendIDA onlyIDA totalIndiaIndonesiaIran, Islamic Rep.IraqIrelandItalyJamaicaJapanJordanKazakhstanKenyaKorea, Dem. People’s Rep.Korea, Rep.KuwaitKyrgyz RepublicLao PDRLate-demographic dividendLatin America & Caribbean Latin America & Caribbean (excluding high income)Latin America & the Caribbean (IDA & IBRD countries)LatviaLeast developed countries: UN classificationLebanonLiberiaLibyaLithuaniaLow & middle incomeLow incomeLower middle incomeLuxembourgMacao SAR, ChinaMacedonia, FYRMadagascarMalawiMalaysiaMaldivesMaliMaltaMauritaniaMauritiusMexicoMiddle East & North AfricaMiddle East & North Africa (excluding high income)Middle East & North Africa (IDA & IBRD countries)Middle incomeMoldovaMongoliaMontenegroMoroccoMozambiqueMyanmarNepalNetherlandsNew CaledoniaNew ZealandNicaraguaNigerNigeriaNorth AmericaNorwayOECD membersOmanOther small statesPacific island small statesPakistanPanamaPapua New GuineaParaguayPeruPhilippinesPolandPortugalPost-demographic dividendPre-demographic dividendQatarRomaniaRussian FederationRwandaSaudi ArabiaSenegalSerbiaSeychellesSierra LeoneSingaporeSlovak RepublicSloveniaSmall statesSomaliaSouth AfricaSouth AsiaSouth Asia (IDA & IBRD)SpainSri LankaSt. LuciaSt. Vincent and the GrenadinesSub-Saharan Africa Sub-Saharan Africa (excluding high income)Sub-Saharan Africa (IDA & IBRD countries)SudanSurinameSwedenSwitzerlandSyrian Arab RepublicTajikistanTanzaniaThailandTogoTrinidad and TobagoTunisiaTurkeyTurkmenistanUgandaUkraineUnited Arab EmiratesUnited KingdomUnited StatesUpper middle incomeUruguayVenezuela, RBVietnamWorldYemen, Rep.ZambiaZimbabwe Timeline:
This timeline shows a graph from 1963 to 2015 of Bahamas, The. No data until 1962. Number of actual observations by date: 51.
Source name:
World Development Indicators
Source organization:
World Bank staff estimates based data from International Monetary Fund's Direction of Trade database.
Categories, topics:
Private Sector, Trade
Last updated:
apr 23, 2017
Indicators value changes by year
Maximum:
63.552
jan 1, 1977
At the date of observation
Value
Absolute change
Change from previous value
jan 1, 1970
0.003
+0.003
%
jan 1, 1971
2.847
+2.844
84.32K%
jan 1, 1972
16.669
+13.821
485.42%
jan 1, 1973
16.327
-0.342
-2.05%
jan 1, 1974
5.058
-11.269
-69.02%
jan 1, 1975
33.648
+28.59
565.24%
jan 1, 1976
50.505
+16.856
50.1%
jan 1, 1977
63.552
+13.048
25.83%
jan 1, 1978
50.229
-13.323
-20.96%
jan 1, 1979
43.833
-6.396
-12.73%
jan 1, 1980
55.606
+11.773
26.86%
jan 1, 1982
16.378
-39.228
-70.55%
jan 1, 1983
20.339
+3.962
24.19%
jan 1, 1984
55.606
+35.267
173.39%
jan 1, 1985
11.194
-44.412
-79.87%
jan 1, 1986
2.73
-8.464
-75.61%
jan 1, 1987
5.554
+2.825
103.48%
jan 1, 1988
25.769
+20.214
363.93%
jan 1, 1989
17.78
-7.989
-31.0%
jan 1, 1990
42.672
+24.891
139.99%
jan 1, 1991
0.983
-41.688
-97.7%
jan 1, 1992
0.02
-0.963
-97.94%
jan 1, 1993
0.001
-0.019
-94.13%
jan 1, 1994
0.37
+0.369
31.09K%
jan 1, 1995
0.117
-0.253
-68.37%
jan 1, 1996
0.0
-0.117
-99.65%
jan 1, 1997
0.278
+0.278
67.04K%
jan 1, 1998
0.005
-0.273
-98.03%
jan 1, 1999
0.605
+0.6
10.93K%
jan 1, 2000
0.521
-0.085
-13.99%
jan 1, 2001
1.64
+1.119
214.94%
jan 1, 2002
0.654
-0.986
-60.11%
jan 1, 2003
0.405
-0.249
-38.05%
jan 1, 2004
0.515
+0.11
27.16%
jan 1, 2005
0.804
+0.288
55.97%
jan 1, 2006
0.561
-0.243
-30.22%
jan 1, 2007
2.533
+1.972
351.74%
jan 1, 2008
4.057
+1.524
60.16%
jan 1, 2009
0.742
-3.315
-81.71%
jan 1, 2010
2.151
+1.409
189.85%
jan 1, 2011
0.693
-1.458
-67.78%
jan 1, 2012
1.141
+0.447
64.55%
jan 1, 2013
1.122
-0.019
-1.64%
jan 1, 2014
1.221
+0.099
8.86%
jan 1, 2015
1.12
-0.101
-8.27%
Ranking of countries by current statistics by years


Comments: