29
/
en
AIzaSyAYiBZKx7MnpbEhh9jyipgxe19OcubqV5w
April 1, 2024
62798
World
WLD
false
2
1
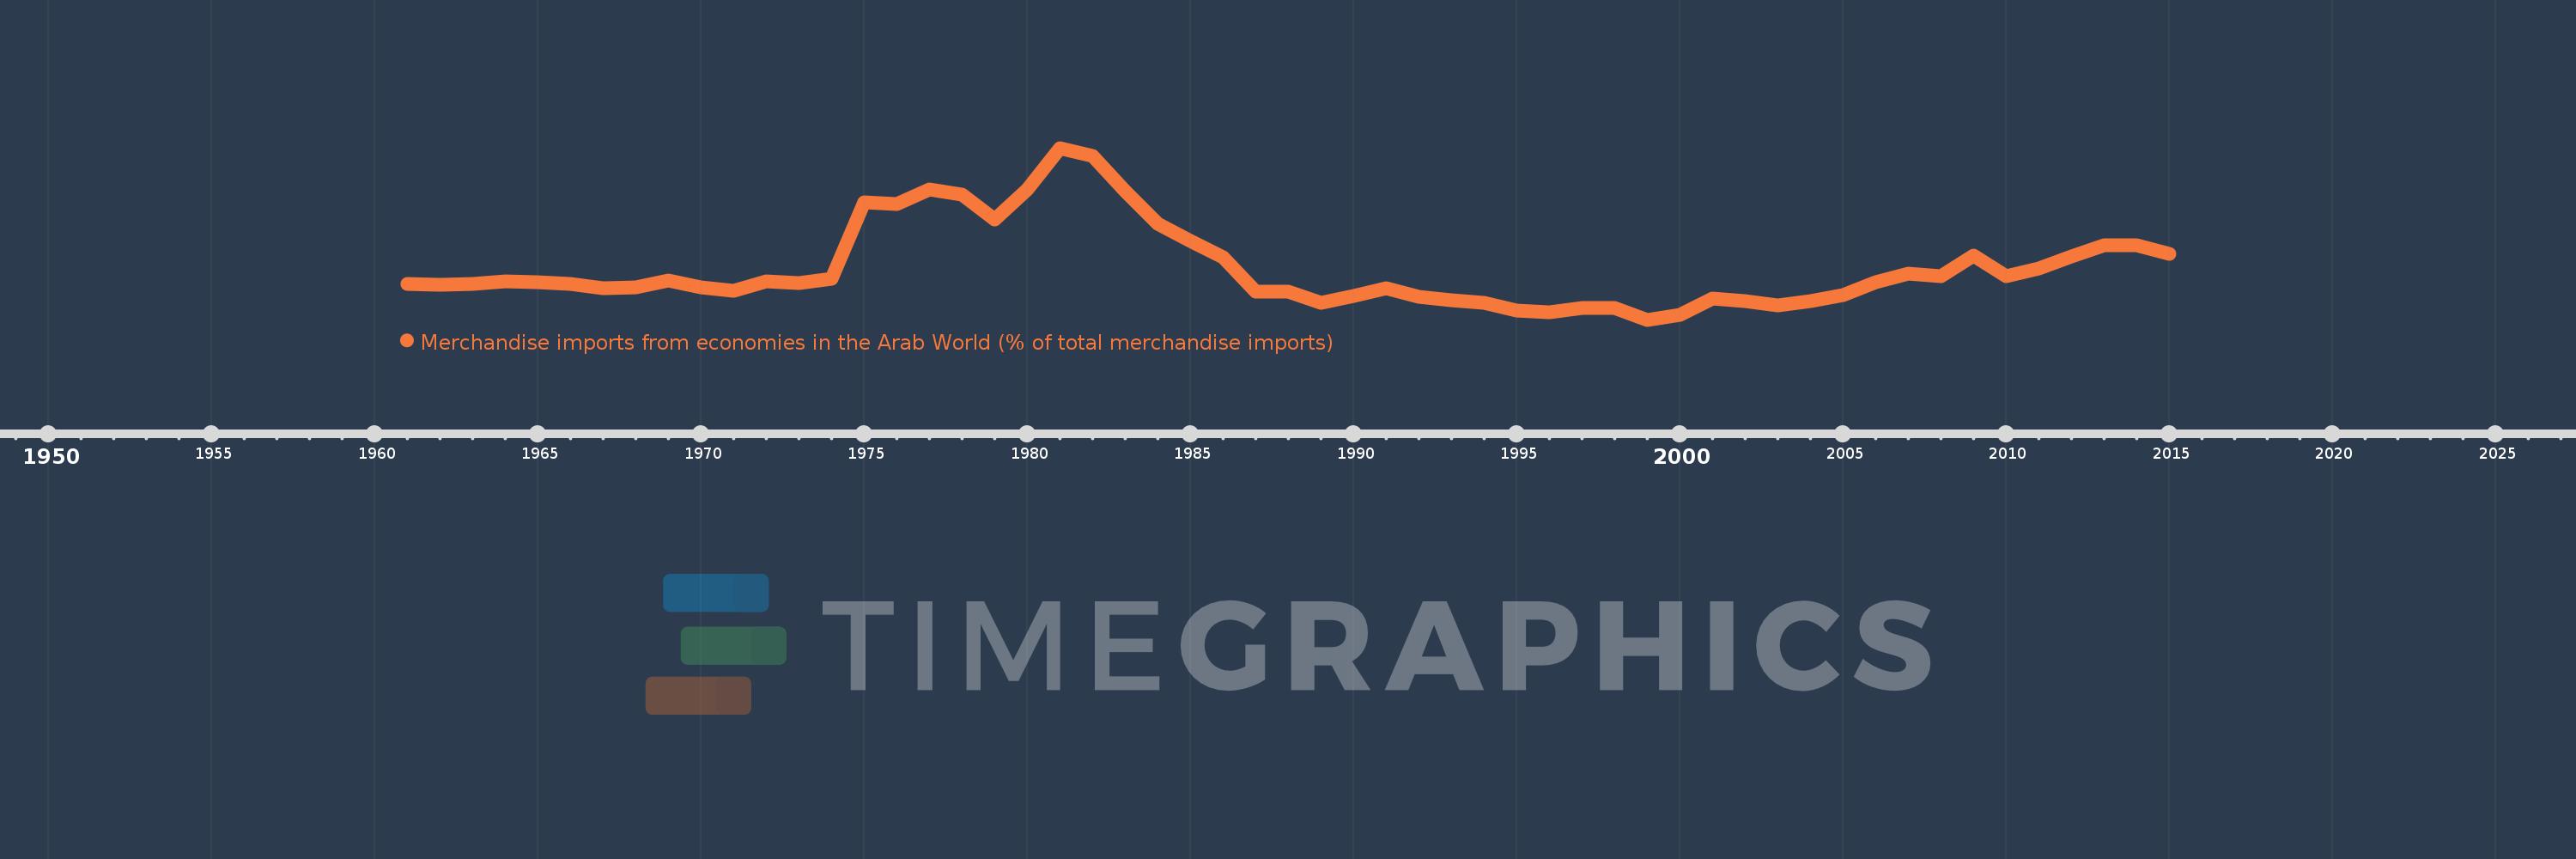
Merchandise imports from economies in the Arab World (% of total merchandise imports)
2015,2014,2013,2012,2011,2010,2009,2008,2007,2006,2005,2004,2003,2002,2001,2000,1999,1998,1997,1996,1995,1994,1993,1992,1991,1990,1989,1988,1987,1986,1985,1984,1983,1982,1981,1980,1979,1978,1977,1976,1975,1974,1973,1972,1971,1970,1969,1968,1967,1966,1965,1964,1963,1962,1961
This statistics in other country:
AfghanistanAlbaniaAlgeriaAngolaArab WorldArgentinaArmeniaArubaAustraliaAustriaAzerbaijanBahamas, TheBahrainBangladeshBarbadosBelarusBelgiumBelizeBeninBermudaBoliviaBrazilBrunei DarussalamBulgariaBurkina FasoBurundiCabo VerdeCambodiaCameroonCanadaCaribbean small statesCentral African RepublicCentral Europe and the BalticsChadChileChinaColombiaComorosCongo, Dem. Rep.Congo, Rep.Costa RicaCote d'IvoireCroatiaCubaCyprusCzech RepublicDenmarkDjiboutiDominicaDominican RepublicEarly-demographic dividendEast Asia & PacificEast Asia & Pacific (excluding high income)East Asia & Pacific (IDA & IBRD countries)EcuadorEgypt, Arab Rep.El SalvadorEstoniaEthiopiaEuro areaEurope & Central AsiaEurope & Central Asia (excluding high income)Europe & Central Asia (IDA & IBRD countries)European UnionFijiFinlandFragile and conflict affected situationsFranceFrench PolynesiaGabonGambia, TheGeorgiaGermanyGhanaGreeceGreenlandGrenadaGuatemalaGuineaGuinea-BissauGuyanaHaitiHeavily indebted poor countries (HIPC)High incomeHondurasHong Kong SAR, ChinaHungaryIBRD onlyIcelandIDA & IBRD totalIDA blendIDA onlyIDA totalIndiaIndonesiaIran, Islamic Rep.IraqIrelandItalyJamaicaJapanJordanKazakhstanKenyaKorea, Dem. People’s Rep.Korea, Rep.KuwaitKyrgyz RepublicLao PDRLate-demographic dividendLatin America & Caribbean Latin America & Caribbean (excluding high income)Latin America & the Caribbean (IDA & IBRD countries)LatviaLeast developed countries: UN classificationLebanonLiberiaLibyaLithuaniaLow & middle incomeLow incomeLower middle incomeLuxembourgMacao SAR, ChinaMacedonia, FYRMadagascarMalawiMalaysiaMaldivesMaliMaltaMauritaniaMauritiusMexicoMiddle East & North AfricaMiddle East & North Africa (excluding high income)Middle East & North Africa (IDA & IBRD countries)Middle incomeMoldovaMongoliaMontenegroMoroccoMozambiqueMyanmarNepalNetherlandsNew CaledoniaNew ZealandNicaraguaNigerNigeriaNorth AmericaNorwayOECD membersOmanOther small statesPacific island small statesPakistanPanamaPapua New GuineaParaguayPeruPhilippinesPolandPortugalPost-demographic dividendPre-demographic dividendQatarRomaniaRussian FederationRwandaSaudi ArabiaSenegalSerbiaSeychellesSierra LeoneSingaporeSlovak RepublicSloveniaSmall statesSomaliaSouth AfricaSouth AsiaSouth Asia (IDA & IBRD)SpainSri LankaSt. LuciaSt. Vincent and the GrenadinesSub-Saharan Africa Sub-Saharan Africa (excluding high income)Sub-Saharan Africa (IDA & IBRD countries)SudanSurinameSwedenSwitzerlandSyrian Arab RepublicTajikistanTanzaniaThailandTogoTrinidad and TobagoTunisiaTurkeyTurkmenistanUgandaUkraineUnited Arab EmiratesUnited KingdomUnited StatesUpper middle incomeUruguayVenezuela, RBVietnamWorldYemen, Rep.ZambiaZimbabwe Timeline:
This timeline shows a graph from 1961 to 2015 of World. No data until 1960. Number of actual observations by date: 55.
Source name:
World Development Indicators
Source organization:
World Bank staff estimates based data from International Monetary Fund's Direction of Trade database.
Categories, topics:
Private Sector, Trade
Last updated:
apr 23, 2017
Indicators value changes by year
Maximum:
12.651
jan 1, 1981
At the date of observation
Value
Absolute change
Change from previous value
jan 1, 1961
4.714
+4.714
0.0%
jan 1, 1962
4.698
-0.015
-0.32%
jan 1, 1963
4.731
+0.033
0.7%
jan 1, 1964
4.869
+0.138
2.91%
jan 1, 1965
4.833
-0.035
-0.73%
jan 1, 1966
4.742
-0.091
-1.89%
jan 1, 1967
4.506
-0.236
-4.98%
jan 1, 1968
4.542
+0.036
0.79%
jan 1, 1969
4.928
+0.387
8.52%
jan 1, 1970
4.561
-0.368
-7.46%
jan 1, 1971
4.359
-0.202
-4.44%
jan 1, 1972
4.888
+0.529
12.15%
jan 1, 1973
4.789
-0.099
-2.03%
jan 1, 1974
5.024
+0.235
4.91%
jan 1, 1975
9.478
+4.454
88.67%
jan 1, 1976
9.367
-0.111
-1.17%
jan 1, 1977
10.223
+0.856
9.13%
jan 1, 1978
9.936
-0.287
-2.8%
jan 1, 1979
8.502
-1.434
-14.43%
jan 1, 1980
10.235
+1.733
20.38%
jan 1, 1981
12.651
+2.415
23.6%
jan 1, 1982
12.211
-0.439
-3.47%
jan 1, 1983
10.12
-2.091
-17.13%
jan 1, 1984
8.238
-1.883
-18.6%
jan 1, 1985
7.237
-1.0
-12.14%
jan 1, 1986
6.264
-0.973
-13.44%
jan 1, 1987
4.264
-2.0
-31.93%
jan 1, 1988
4.267
+0.003
0.06%
jan 1, 1989
3.636
-0.631
-14.78%
jan 1, 1990
4.032
+0.396
10.9%
jan 1, 1991
4.473
+0.441
10.94%
jan 1, 1992
3.965
-0.509
-11.37%
jan 1, 1993
3.769
-0.196
-4.94%
jan 1, 1994
3.614
-0.155
-4.11%
jan 1, 1995
3.197
-0.417
-11.54%
jan 1, 1996
3.071
-0.126
-3.95%
jan 1, 1997
3.326
+0.256
8.32%
jan 1, 1998
3.348
+0.022
0.65%
jan 1, 1999
2.652
-0.696
-20.79%
jan 1, 2000
2.959
+0.307
11.58%
jan 1, 2001
3.868
+0.909
30.73%
jan 1, 2002
3.729
-0.139
-3.59%
jan 1, 2003
3.477
-0.252
-6.75%
jan 1, 2004
3.715
+0.238
6.84%
jan 1, 2005
4.079
+0.364
9.79%
jan 1, 2006
4.84
+0.761
18.66%
jan 1, 2007
5.346
+0.506
10.46%
jan 1, 2008
5.168
-0.179
-3.34%
jan 1, 2009
6.364
+1.196
23.14%
jan 1, 2010
5.176
-1.188
-18.67%
jan 1, 2011
5.642
+0.466
9.01%
jan 1, 2012
6.317
+0.675
11.96%
jan 1, 2013
7.011
+0.695
11.0%
jan 1, 2014
6.98
-0.031
-0.44%
jan 1, 2015
6.477
-0.504
-7.22%
Ranking of countries by current statistics by years


Comments: