29
/
en
AIzaSyAYiBZKx7MnpbEhh9jyipgxe19OcubqV5w
April 1, 2024
83708
Benin
BEN
true
2
1
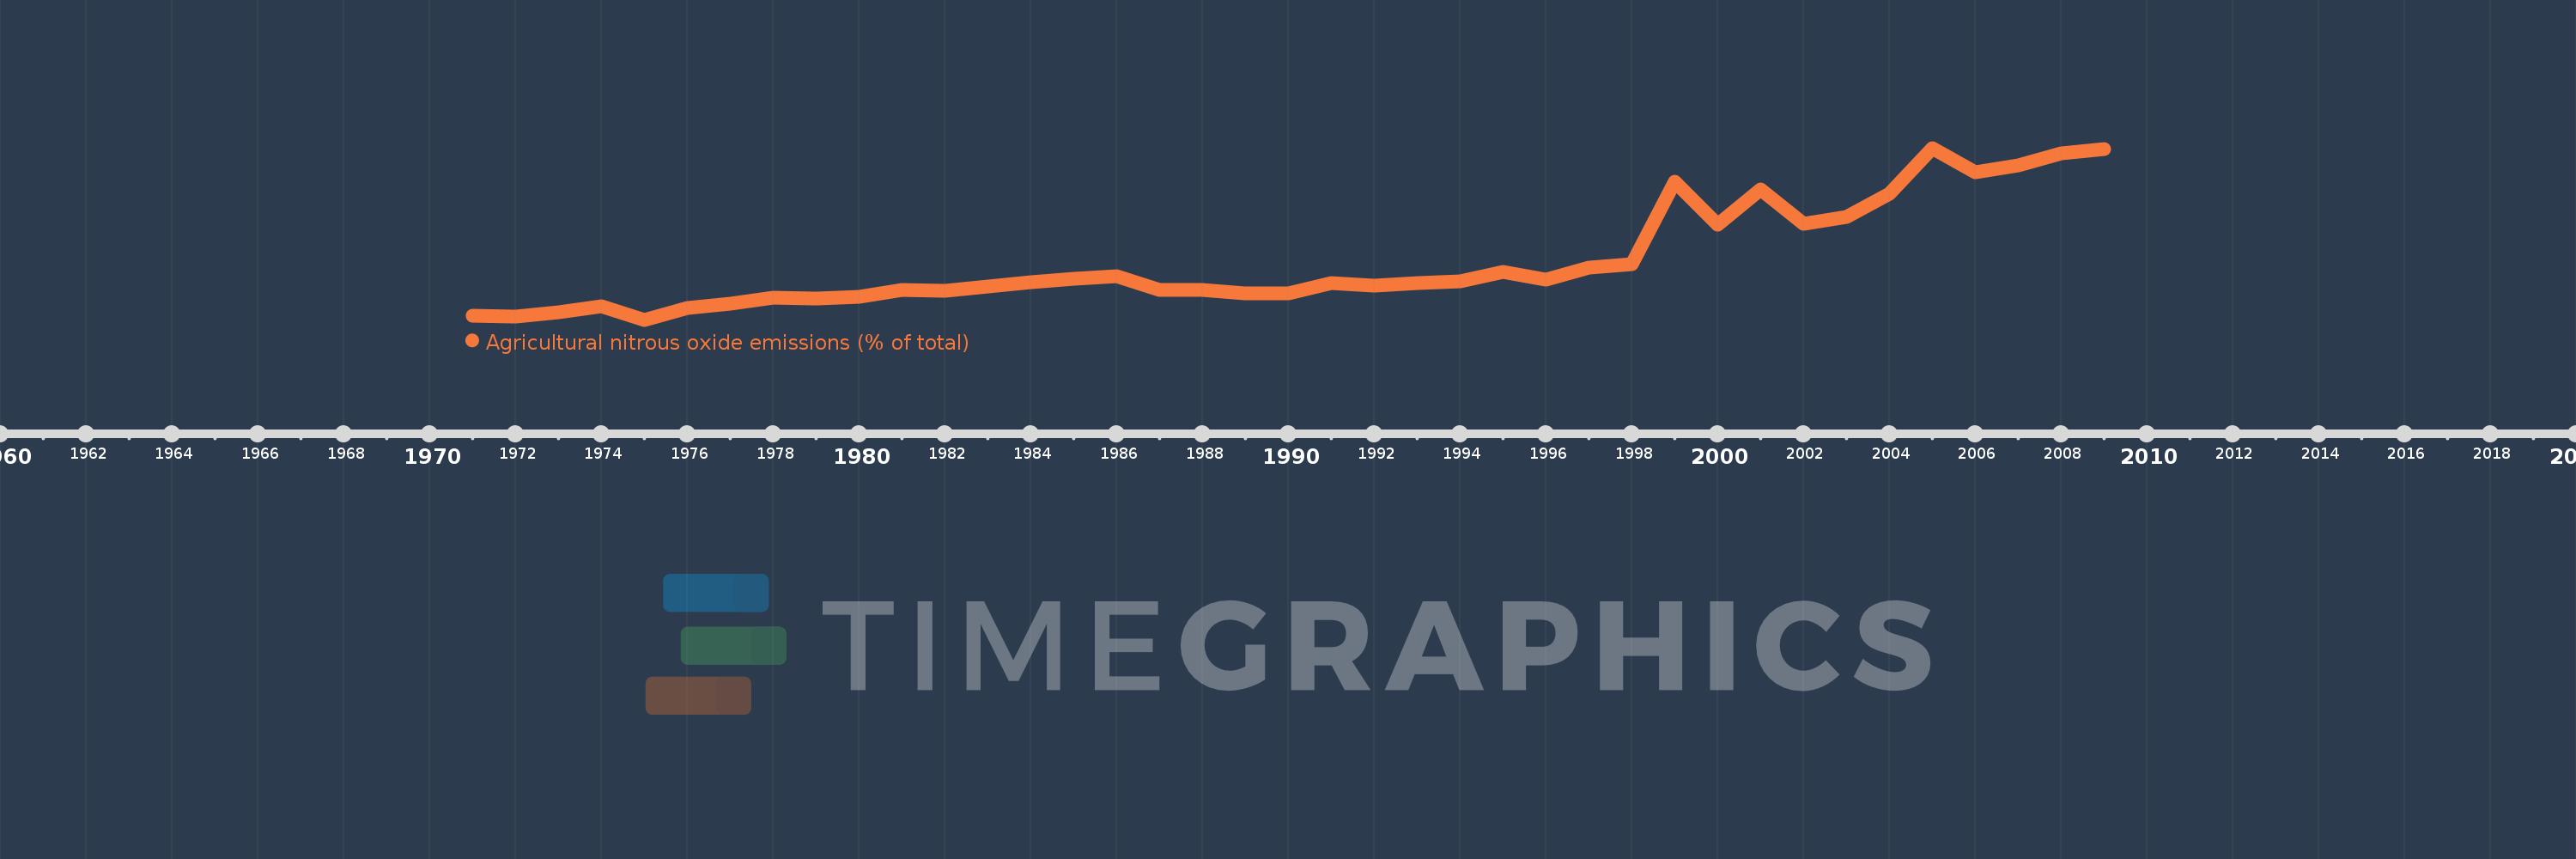
Agricultural nitrous oxide emissions (% of total)
2009,2008,2007,2006,2005,2004,2003,2002,2001,2000,1999,1998,1997,1996,1995,1994,1993,1992,1991,1990,1989,1988,1987,1986,1985,1984,1983,1982,1981,1980,1979,1978,1977,1976,1975,1974,1973,1972,1971
This statistics in other country:
AfghanistanAlbaniaAlgeriaAmerican SamoaAndorraAngolaAntigua and BarbudaArab WorldArgentinaArmeniaArubaAustraliaAustriaAzerbaijanBahamas, TheBahrainBangladeshBarbadosBelarusBelgiumBelizeBeninBermudaBhutanBoliviaBosnia and HerzegovinaBotswanaBrazilBritish Virgin IslandsBrunei DarussalamBulgariaBurkina FasoBurundiCabo VerdeCambodiaCameroonCanadaCaribbean small statesCayman IslandsCentral African RepublicCentral Europe and the BalticsChadChileChinaColombiaComorosCongo, Dem. Rep.Congo, Rep.Costa RicaCote d'IvoireCroatiaCubaCyprusCzech RepublicDenmarkDjiboutiDominicaDominican RepublicEarly-demographic dividendEast Asia & PacificEast Asia & Pacific (excluding high income)East Asia & Pacific (IDA & IBRD countries)EcuadorEgypt, Arab Rep.El SalvadorEquatorial GuineaEritreaEstoniaEthiopiaEuro areaEurope & Central AsiaEurope & Central Asia (excluding high income)Europe & Central Asia (IDA & IBRD countries)European UnionFaroe IslandsFijiFinlandFragile and conflict affected situationsFranceFrench PolynesiaGabonGambia, TheGeorgiaGermanyGhanaGibraltarGreeceGreenlandGrenadaGuamGuatemalaGuineaGuinea-BissauGuyanaHaitiHeavily indebted poor countries (HIPC)High incomeHondurasHong Kong SAR, ChinaHungaryIBRD onlyIcelandIDA & IBRD totalIDA blendIDA onlyIDA totalIndiaIndonesiaIran, Islamic Rep.IraqIrelandIsraelItalyJamaicaJapanJordanKazakhstanKenyaKiribatiKorea, Dem. People’s Rep.Korea, Rep.KuwaitKyrgyz RepublicLao PDRLate-demographic dividendLatin America & Caribbean Latin America & Caribbean (excluding high income)Latin America & the Caribbean (IDA & IBRD countries)LatviaLeast developed countries: UN classificationLebanonLesothoLiberiaLibyaLithuaniaLow & middle incomeLow incomeLower middle incomeLuxembourgMacao SAR, ChinaMacedonia, FYRMadagascarMalawiMalaysiaMaldivesMaliMaltaMarshall IslandsMauritaniaMauritiusMexicoMicronesia, Fed. Sts.Middle East & North AfricaMiddle East & North Africa (excluding high income)Middle East & North Africa (IDA & IBRD countries)Middle incomeMoldovaMongoliaMoroccoMozambiqueMyanmarNamibiaNauruNepalNetherlandsNew CaledoniaNew ZealandNicaraguaNigerNigeriaNorth AmericaNorthern Mariana IslandsNorwayOECD membersOmanOther small statesPacific island small statesPakistanPalauPanamaPapua New GuineaParaguayPeruPhilippinesPolandPortugalPost-demographic dividendPre-demographic dividendPuerto RicoQatarRomaniaRussian FederationRwandaSamoaSao Tome and PrincipeSaudi ArabiaSenegalSerbiaSeychellesSierra LeoneSingaporeSlovak RepublicSloveniaSmall statesSolomon IslandsSomaliaSouth AfricaSouth AsiaSouth Asia (IDA & IBRD)SpainSri LankaSt. Kitts and NevisSt. LuciaSt. Vincent and the GrenadinesSub-Saharan Africa Sub-Saharan Africa (excluding high income)Sub-Saharan Africa (IDA & IBRD countries)SudanSurinameSwazilandSwedenSwitzerlandSyrian Arab RepublicTajikistanTanzaniaThailandTimor-LesteTogoTongaTrinidad and TobagoTunisiaTurkeyTurkmenistanTurks and Caicos IslandsTuvaluUgandaUkraineUnited Arab EmiratesUnited KingdomUnited StatesUpper middle incomeUruguayUzbekistanVanuatuVenezuela, RBVietnamVirgin Islands (U.S.)WorldYemen, Rep.ZambiaZimbabwe Timeline:
This timeline shows a graph from 1971 to 2009 of Benin. No data until 1970. Number of actual observations by date: 39.
Source name:
World Development Indicators
Source organization:
World Bank staff estimates from original source: European Commission, Joint Research Centre (JRC)/Netherlands Environmental Assessment Agency (PBL). Emission Database for Global Atmospheric Research (EDGAR): http://edgar.jrc.ec.europa.eu/.
Categories, topics:
Agriculture & Rural Development, Environment
Last updated:
apr 23, 2017
Indicators value changes by year
Minimum:
44.623
jan 1, 1975
Maximum:
62.744
jan 1, 2005
At the date of observation
Value
Absolute change
Change from previous value
jan 1, 1971
45.04
+45.04
0.0%
jan 1, 1972
44.986
-0.054
-0.12%
jan 1, 1973
45.386
+0.4
0.89%
jan 1, 1974
46.087
+0.701
1.55%
jan 1, 1975
44.623
-1.464
-3.18%
jan 1, 1976
45.825
+1.201
2.69%
jan 1, 1977
46.336
+0.512
1.12%
jan 1, 1978
46.923
+0.587
1.27%
jan 1, 1979
46.877
-0.046
-0.1%
jan 1, 1980
47.079
+0.202
0.43%
jan 1, 1981
47.805
+0.726
1.54%
jan 1, 1982
47.676
-0.129
-0.27%
jan 1, 1983
48.087
+0.411
0.86%
jan 1, 1984
48.611
+0.524
1.09%
jan 1, 1985
48.908
+0.297
0.61%
jan 1, 1986
49.174
+0.266
0.54%
jan 1, 1987
47.744
-1.43
-2.91%
jan 1, 1988
47.752
+0.008
0.02%
jan 1, 1989
47.405
-0.347
-0.73%
jan 1, 1990
47.436
+0.031
0.07%
jan 1, 1991
48.521
+1.085
2.29%
jan 1, 1992
48.185
-0.336
-0.69%
jan 1, 1993
48.512
+0.327
0.68%
jan 1, 1994
48.642
+0.13
0.27%
jan 1, 1995
49.662
+1.02
2.1%
jan 1, 1996
48.892
-0.769
-1.55%
jan 1, 1997
50.138
+1.245
2.55%
jan 1, 1998
50.469
+0.331
0.66%
jan 1, 1999
59.172
+8.704
17.25%
jan 1, 2000
54.617
-4.556
-7.7%
jan 1, 2001
58.358
+3.742
6.85%
jan 1, 2002
54.77
-3.588
-6.15%
jan 1, 2003
55.473
+0.703
1.28%
jan 1, 2004
57.927
+2.454
4.42%
jan 1, 2005
62.744
+4.817
8.32%
jan 1, 2006
60.177
-2.567
-4.09%
jan 1, 2007
60.932
+0.755
1.25%
jan 1, 2008
62.143
+1.21
1.99%
jan 1, 2009
62.594
+0.451
0.73%
Ranking of countries by current statistics by years


Comments: