29
/
en
AIzaSyAYiBZKx7MnpbEhh9jyipgxe19OcubqV5w
April 1, 2024
238036
Seychelles
SYC
true
2
1
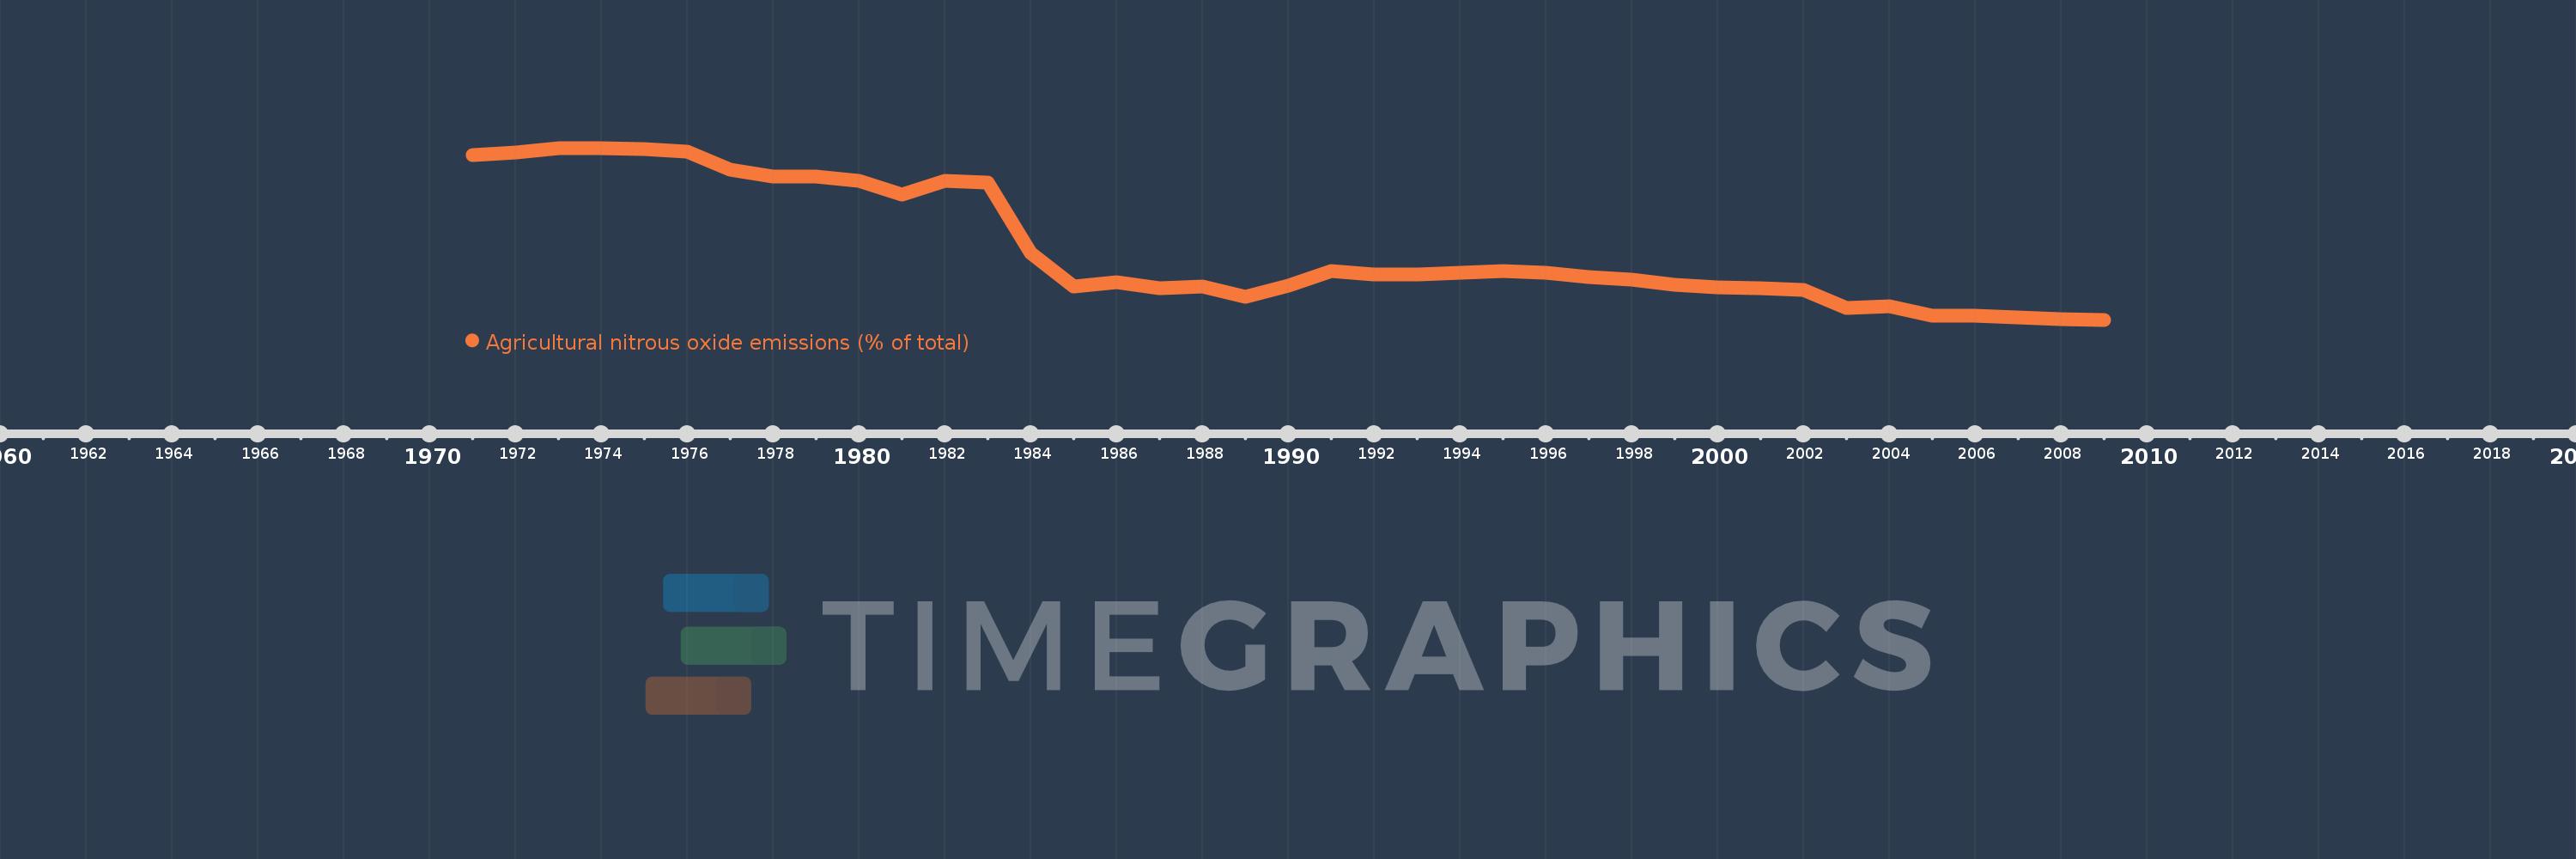
Agricultural nitrous oxide emissions (% of total)
2009,2008,2007,2006,2005,2004,2003,2002,2001,2000,1999,1998,1997,1996,1995,1994,1993,1992,1991,1990,1989,1988,1987,1986,1985,1984,1983,1982,1981,1980,1979,1978,1977,1976,1975,1974,1973,1972,1971
This statistics in other country:
AfghanistanAlbaniaAlgeriaAmerican SamoaAndorraAngolaAntigua and BarbudaArab WorldArgentinaArmeniaArubaAustraliaAustriaAzerbaijanBahamas, TheBahrainBangladeshBarbadosBelarusBelgiumBelizeBeninBermudaBhutanBoliviaBosnia and HerzegovinaBotswanaBrazilBritish Virgin IslandsBrunei DarussalamBulgariaBurkina FasoBurundiCabo VerdeCambodiaCameroonCanadaCaribbean small statesCayman IslandsCentral African RepublicCentral Europe and the BalticsChadChileChinaColombiaComorosCongo, Dem. Rep.Congo, Rep.Costa RicaCote d'IvoireCroatiaCubaCyprusCzech RepublicDenmarkDjiboutiDominicaDominican RepublicEarly-demographic dividendEast Asia & PacificEast Asia & Pacific (excluding high income)East Asia & Pacific (IDA & IBRD countries)EcuadorEgypt, Arab Rep.El SalvadorEquatorial GuineaEritreaEstoniaEthiopiaEuro areaEurope & Central AsiaEurope & Central Asia (excluding high income)Europe & Central Asia (IDA & IBRD countries)European UnionFaroe IslandsFijiFinlandFragile and conflict affected situationsFranceFrench PolynesiaGabonGambia, TheGeorgiaGermanyGhanaGibraltarGreeceGreenlandGrenadaGuamGuatemalaGuineaGuinea-BissauGuyanaHaitiHeavily indebted poor countries (HIPC)High incomeHondurasHong Kong SAR, ChinaHungaryIBRD onlyIcelandIDA & IBRD totalIDA blendIDA onlyIDA totalIndiaIndonesiaIran, Islamic Rep.IraqIrelandIsraelItalyJamaicaJapanJordanKazakhstanKenyaKiribatiKorea, Dem. People’s Rep.Korea, Rep.KuwaitKyrgyz RepublicLao PDRLate-demographic dividendLatin America & Caribbean Latin America & Caribbean (excluding high income)Latin America & the Caribbean (IDA & IBRD countries)LatviaLeast developed countries: UN classificationLebanonLesothoLiberiaLibyaLithuaniaLow & middle incomeLow incomeLower middle incomeLuxembourgMacao SAR, ChinaMacedonia, FYRMadagascarMalawiMalaysiaMaldivesMaliMaltaMarshall IslandsMauritaniaMauritiusMexicoMicronesia, Fed. Sts.Middle East & North AfricaMiddle East & North Africa (excluding high income)Middle East & North Africa (IDA & IBRD countries)Middle incomeMoldovaMongoliaMoroccoMozambiqueMyanmarNamibiaNauruNepalNetherlandsNew CaledoniaNew ZealandNicaraguaNigerNigeriaNorth AmericaNorthern Mariana IslandsNorwayOECD membersOmanOther small statesPacific island small statesPakistanPalauPanamaPapua New GuineaParaguayPeruPhilippinesPolandPortugalPost-demographic dividendPre-demographic dividendPuerto RicoQatarRomaniaRussian FederationRwandaSamoaSao Tome and PrincipeSaudi ArabiaSenegalSerbiaSeychellesSierra LeoneSingaporeSlovak RepublicSloveniaSmall statesSolomon IslandsSomaliaSouth AfricaSouth AsiaSouth Asia (IDA & IBRD)SpainSri LankaSt. Kitts and NevisSt. LuciaSt. Vincent and the GrenadinesSub-Saharan Africa Sub-Saharan Africa (excluding high income)Sub-Saharan Africa (IDA & IBRD countries)SudanSurinameSwazilandSwedenSwitzerlandSyrian Arab RepublicTajikistanTanzaniaThailandTimor-LesteTogoTongaTrinidad and TobagoTunisiaTurkeyTurkmenistanTurks and Caicos IslandsTuvaluUgandaUkraineUnited Arab EmiratesUnited KingdomUnited StatesUpper middle incomeUruguayUzbekistanVanuatuVenezuela, RBVietnamVirgin Islands (U.S.)WorldYemen, Rep.ZambiaZimbabwe Timeline:
This timeline shows a graph from 1971 to 2009 of Seychelles. No data until 1970. Number of actual observations by date: 39.
Source name:
World Development Indicators
Source organization:
World Bank staff estimates from original source: European Commission, Joint Research Centre (JRC)/Netherlands Environmental Assessment Agency (PBL). Emission Database for Global Atmospheric Research (EDGAR): http://edgar.jrc.ec.europa.eu/.
Categories, topics:
Agriculture & Rural Development, Environment
Last updated:
apr 23, 2017
Indicators value changes by year
Minimum:
22.358
jan 1, 2009
Maximum:
80.254
jan 1, 1974
At the date of observation
Value
Absolute change
Change from previous value
jan 1, 1971
77.828
+77.828
0.0%
jan 1, 1972
78.647
+0.82
1.05%
jan 1, 1973
80.074
+1.427
1.81%
jan 1, 1974
80.254
+0.18
0.23%
jan 1, 1975
79.996
-0.258
-0.32%
jan 1, 1976
79.1
-0.897
-1.12%
jan 1, 1977
73.074
-6.026
-7.62%
jan 1, 1978
70.726
-2.348
-3.21%
jan 1, 1979
70.48
-0.246
-0.35%
jan 1, 1980
69.266
-1.215
-1.72%
jan 1, 1981
64.579
-4.686
-6.77%
jan 1, 1982
69.268
+4.689
7.26%
jan 1, 1983
68.583
-0.685
-0.99%
jan 1, 1984
44.992
-23.592
-34.4%
jan 1, 1985
33.601
-11.391
-25.32%
jan 1, 1986
34.869
+1.269
3.78%
jan 1, 1987
33.061
-1.809
-5.19%
jan 1, 1988
33.498
+0.438
1.32%
jan 1, 1989
30.069
-3.43
-10.24%
jan 1, 1990
33.849
+3.78
12.57%
jan 1, 1991
38.849
+5.0
14.77%
jan 1, 1992
37.714
-1.135
-2.92%
jan 1, 1993
37.612
-0.102
-0.27%
jan 1, 1994
38.095
+0.483
1.28%
jan 1, 1995
38.853
+0.758
1.99%
jan 1, 1996
38.279
-0.574
-1.48%
jan 1, 1997
36.683
-1.596
-4.17%
jan 1, 1998
35.832
-0.85
-2.32%
jan 1, 1999
34.135
-1.697
-4.74%
jan 1, 2000
33.414
-0.721
-2.11%
jan 1, 2001
32.862
-0.552
-1.65%
jan 1, 2002
32.35
-0.512
-1.56%
jan 1, 2003
26.208
-6.142
-18.99%
jan 1, 2004
27.025
+0.817
3.12%
jan 1, 2005
23.789
-3.236
-11.98%
jan 1, 2006
23.853
+0.064
0.27%
jan 1, 2007
23.212
-0.641
-2.69%
jan 1, 2008
22.495
-0.717
-3.09%
jan 1, 2009
22.358
-0.137
-0.61%
Ranking of countries by current statistics by years


Comments: