29
/
en
AIzaSyAYiBZKx7MnpbEhh9jyipgxe19OcubqV5w
April 1, 2024
175023
Latvia
LVA
true
2
1
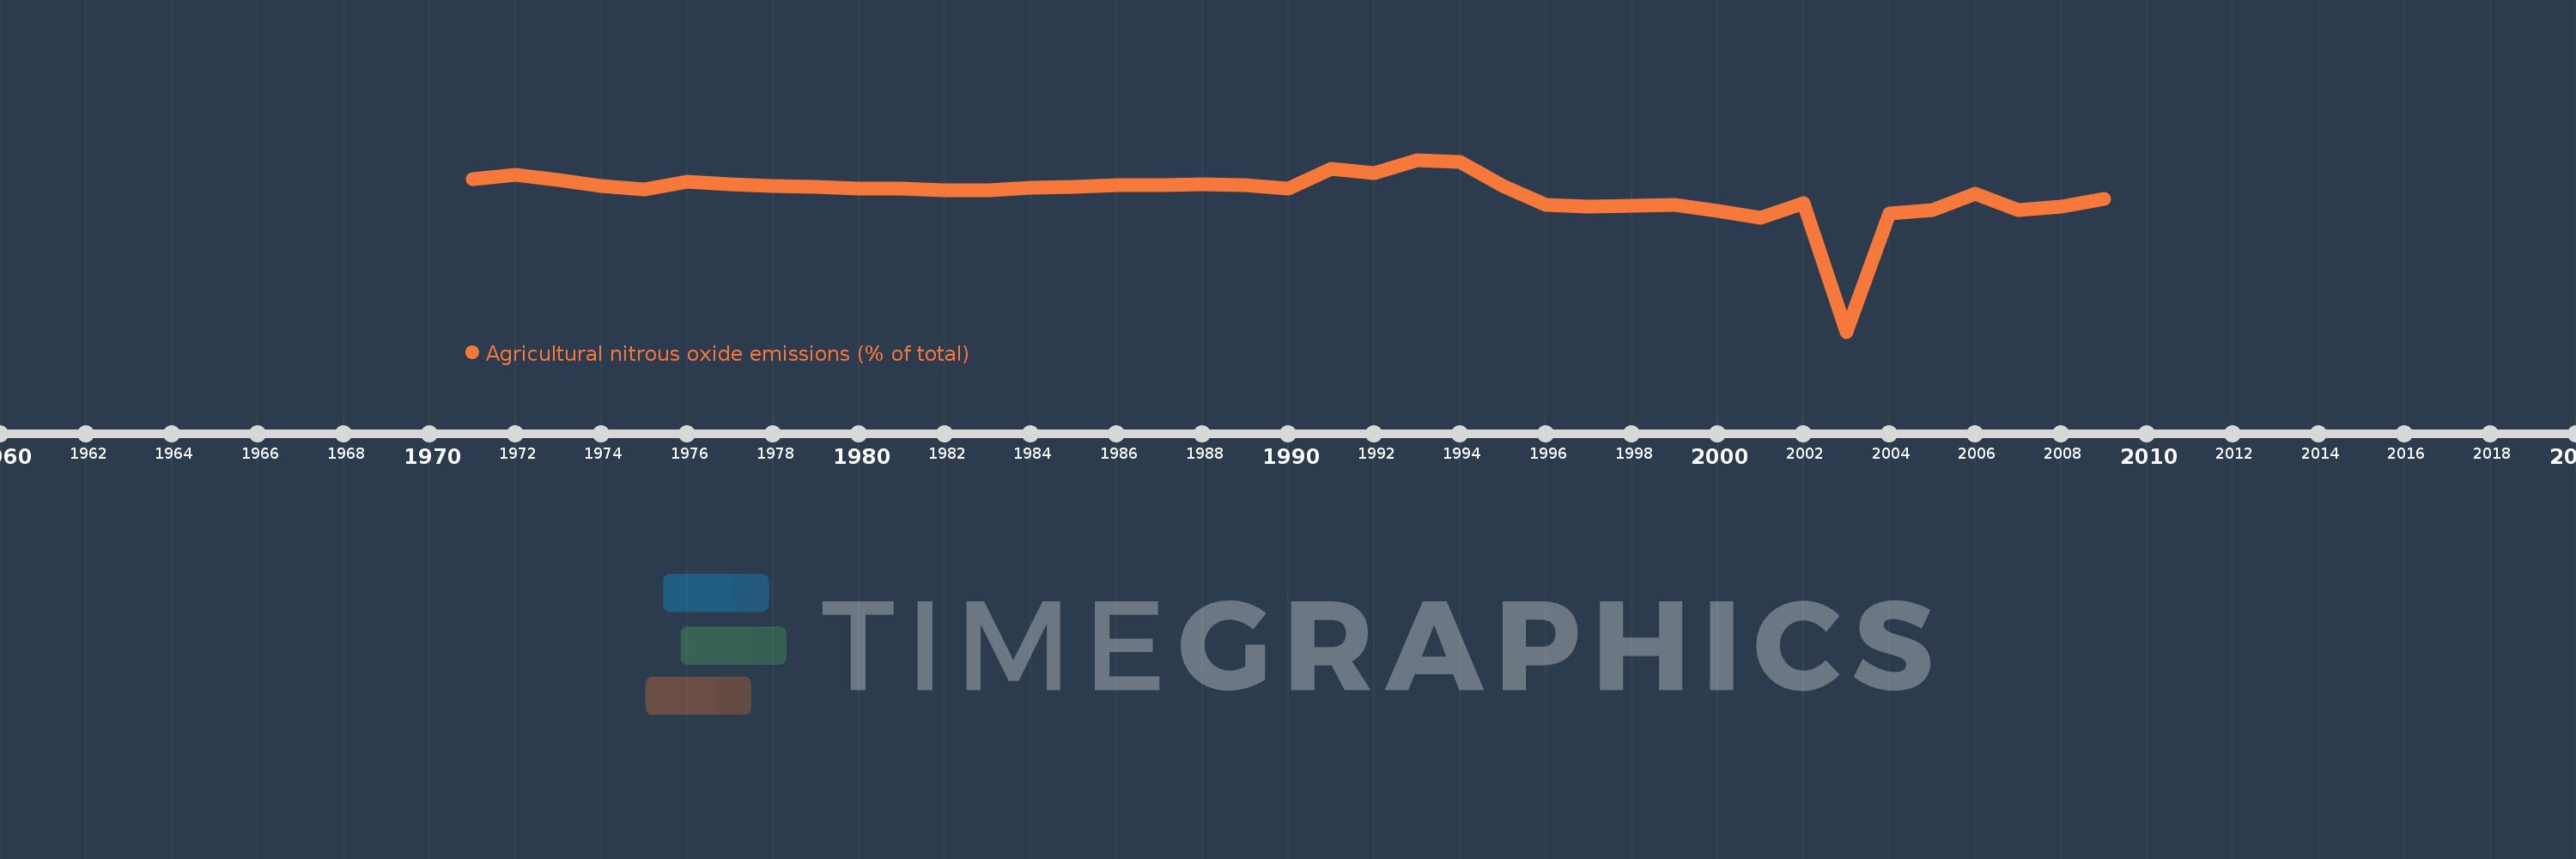
Agricultural nitrous oxide emissions (% of total)
2009,2008,2007,2006,2005,2004,2003,2002,2001,2000,1999,1998,1997,1996,1995,1994,1993,1992,1991,1990,1989,1988,1987,1986,1985,1984,1983,1982,1981,1980,1979,1978,1977,1976,1975,1974,1973,1972,1971
This statistics in other country:
AfghanistanAlbaniaAlgeriaAmerican SamoaAndorraAngolaAntigua and BarbudaArab WorldArgentinaArmeniaArubaAustraliaAustriaAzerbaijanBahamas, TheBahrainBangladeshBarbadosBelarusBelgiumBelizeBeninBermudaBhutanBoliviaBosnia and HerzegovinaBotswanaBrazilBritish Virgin IslandsBrunei DarussalamBulgariaBurkina FasoBurundiCabo VerdeCambodiaCameroonCanadaCaribbean small statesCayman IslandsCentral African RepublicCentral Europe and the BalticsChadChileChinaColombiaComorosCongo, Dem. Rep.Congo, Rep.Costa RicaCote d'IvoireCroatiaCubaCyprusCzech RepublicDenmarkDjiboutiDominicaDominican RepublicEarly-demographic dividendEast Asia & PacificEast Asia & Pacific (excluding high income)East Asia & Pacific (IDA & IBRD countries)EcuadorEgypt, Arab Rep.El SalvadorEquatorial GuineaEritreaEstoniaEthiopiaEuro areaEurope & Central AsiaEurope & Central Asia (excluding high income)Europe & Central Asia (IDA & IBRD countries)European UnionFaroe IslandsFijiFinlandFragile and conflict affected situationsFranceFrench PolynesiaGabonGambia, TheGeorgiaGermanyGhanaGibraltarGreeceGreenlandGrenadaGuamGuatemalaGuineaGuinea-BissauGuyanaHaitiHeavily indebted poor countries (HIPC)High incomeHondurasHong Kong SAR, ChinaHungaryIBRD onlyIcelandIDA & IBRD totalIDA blendIDA onlyIDA totalIndiaIndonesiaIran, Islamic Rep.IraqIrelandIsraelItalyJamaicaJapanJordanKazakhstanKenyaKiribatiKorea, Dem. People’s Rep.Korea, Rep.KuwaitKyrgyz RepublicLao PDRLate-demographic dividendLatin America & Caribbean Latin America & Caribbean (excluding high income)Latin America & the Caribbean (IDA & IBRD countries)LatviaLeast developed countries: UN classificationLebanonLesothoLiberiaLibyaLithuaniaLow & middle incomeLow incomeLower middle incomeLuxembourgMacao SAR, ChinaMacedonia, FYRMadagascarMalawiMalaysiaMaldivesMaliMaltaMarshall IslandsMauritaniaMauritiusMexicoMicronesia, Fed. Sts.Middle East & North AfricaMiddle East & North Africa (excluding high income)Middle East & North Africa (IDA & IBRD countries)Middle incomeMoldovaMongoliaMoroccoMozambiqueMyanmarNamibiaNauruNepalNetherlandsNew CaledoniaNew ZealandNicaraguaNigerNigeriaNorth AmericaNorthern Mariana IslandsNorwayOECD membersOmanOther small statesPacific island small statesPakistanPalauPanamaPapua New GuineaParaguayPeruPhilippinesPolandPortugalPost-demographic dividendPre-demographic dividendPuerto RicoQatarRomaniaRussian FederationRwandaSamoaSao Tome and PrincipeSaudi ArabiaSenegalSerbiaSeychellesSierra LeoneSingaporeSlovak RepublicSloveniaSmall statesSolomon IslandsSomaliaSouth AfricaSouth AsiaSouth Asia (IDA & IBRD)SpainSri LankaSt. Kitts and NevisSt. LuciaSt. Vincent and the GrenadinesSub-Saharan Africa Sub-Saharan Africa (excluding high income)Sub-Saharan Africa (IDA & IBRD countries)SudanSurinameSwazilandSwedenSwitzerlandSyrian Arab RepublicTajikistanTanzaniaThailandTimor-LesteTogoTongaTrinidad and TobagoTunisiaTurkeyTurkmenistanTurks and Caicos IslandsTuvaluUgandaUkraineUnited Arab EmiratesUnited KingdomUnited StatesUpper middle incomeUruguayUzbekistanVanuatuVenezuela, RBVietnamVirgin Islands (U.S.)WorldYemen, Rep.ZambiaZimbabwe Timeline:
This timeline shows a graph from 1971 to 2009 of Latvia. No data until 1970. Number of actual observations by date: 39.
Source name:
World Development Indicators
Source organization:
World Bank staff estimates from original source: European Commission, Joint Research Centre (JRC)/Netherlands Environmental Assessment Agency (PBL). Emission Database for Global Atmospheric Research (EDGAR): http://edgar.jrc.ec.europa.eu/.
Categories, topics:
Agriculture & Rural Development, Environment
Last updated:
apr 23, 2017
Indicators value changes by year
Minimum:
50.464
jan 1, 2003
Maximum:
82.803
jan 1, 1993
At the date of observation
Value
Absolute change
Change from previous value
jan 1, 1971
79.171
+79.171
0.0%
jan 1, 1972
79.953
+0.782
0.99%
jan 1, 1973
78.969
-0.984
-1.23%
jan 1, 1974
77.908
-1.062
-1.34%
jan 1, 1975
77.182
-0.726
-0.93%
jan 1, 1976
78.621
+1.439
1.86%
jan 1, 1977
78.199
-0.423
-0.54%
jan 1, 1978
77.853
-0.346
-0.44%
jan 1, 1979
77.635
-0.217
-0.28%
jan 1, 1980
77.309
-0.326
-0.42%
jan 1, 1981
77.378
+0.069
0.09%
jan 1, 1982
76.993
-0.386
-0.5%
jan 1, 1983
76.987
-0.006
-0.01%
jan 1, 1984
77.546
+0.56
0.73%
jan 1, 1985
77.743
+0.196
0.25%
jan 1, 1986
78.01
+0.268
0.34%
jan 1, 1987
77.969
-0.041
-0.05%
jan 1, 1988
78.26
+0.291
0.37%
jan 1, 1989
78.109
-0.151
-0.19%
jan 1, 1990
77.413
-0.696
-0.89%
jan 1, 1991
81.056
+3.643
4.71%
jan 1, 1992
80.252
-0.804
-0.99%
jan 1, 1993
82.803
+2.551
3.18%
jan 1, 1994
82.407
-0.396
-0.48%
jan 1, 1995
77.831
-4.576
-5.55%
jan 1, 1996
74.369
-3.462
-4.45%
jan 1, 1997
74.015
-0.354
-0.48%
jan 1, 1998
74.114
+0.099
0.13%
jan 1, 1999
74.344
+0.23
0.31%
jan 1, 2000
73.168
-1.176
-1.58%
jan 1, 2001
71.865
-1.303
-1.78%
jan 1, 2002
74.688
+2.823
3.93%
jan 1, 2003
50.464
-24.223
-32.43%
jan 1, 2004
72.64
+22.176
43.94%
jan 1, 2005
73.397
+0.756
1.04%
jan 1, 2006
76.424
+3.027
4.12%
jan 1, 2007
73.363
-3.061
-4.01%
jan 1, 2008
73.953
+0.589
0.8%
jan 1, 2009
75.42
+1.467
1.98%
Ranking of countries by current statistics by years


Comments: