29
/
en
AIzaSyAYiBZKx7MnpbEhh9jyipgxe19OcubqV5w
April 1, 2024
115569
Cuba
CUB
true
2
1
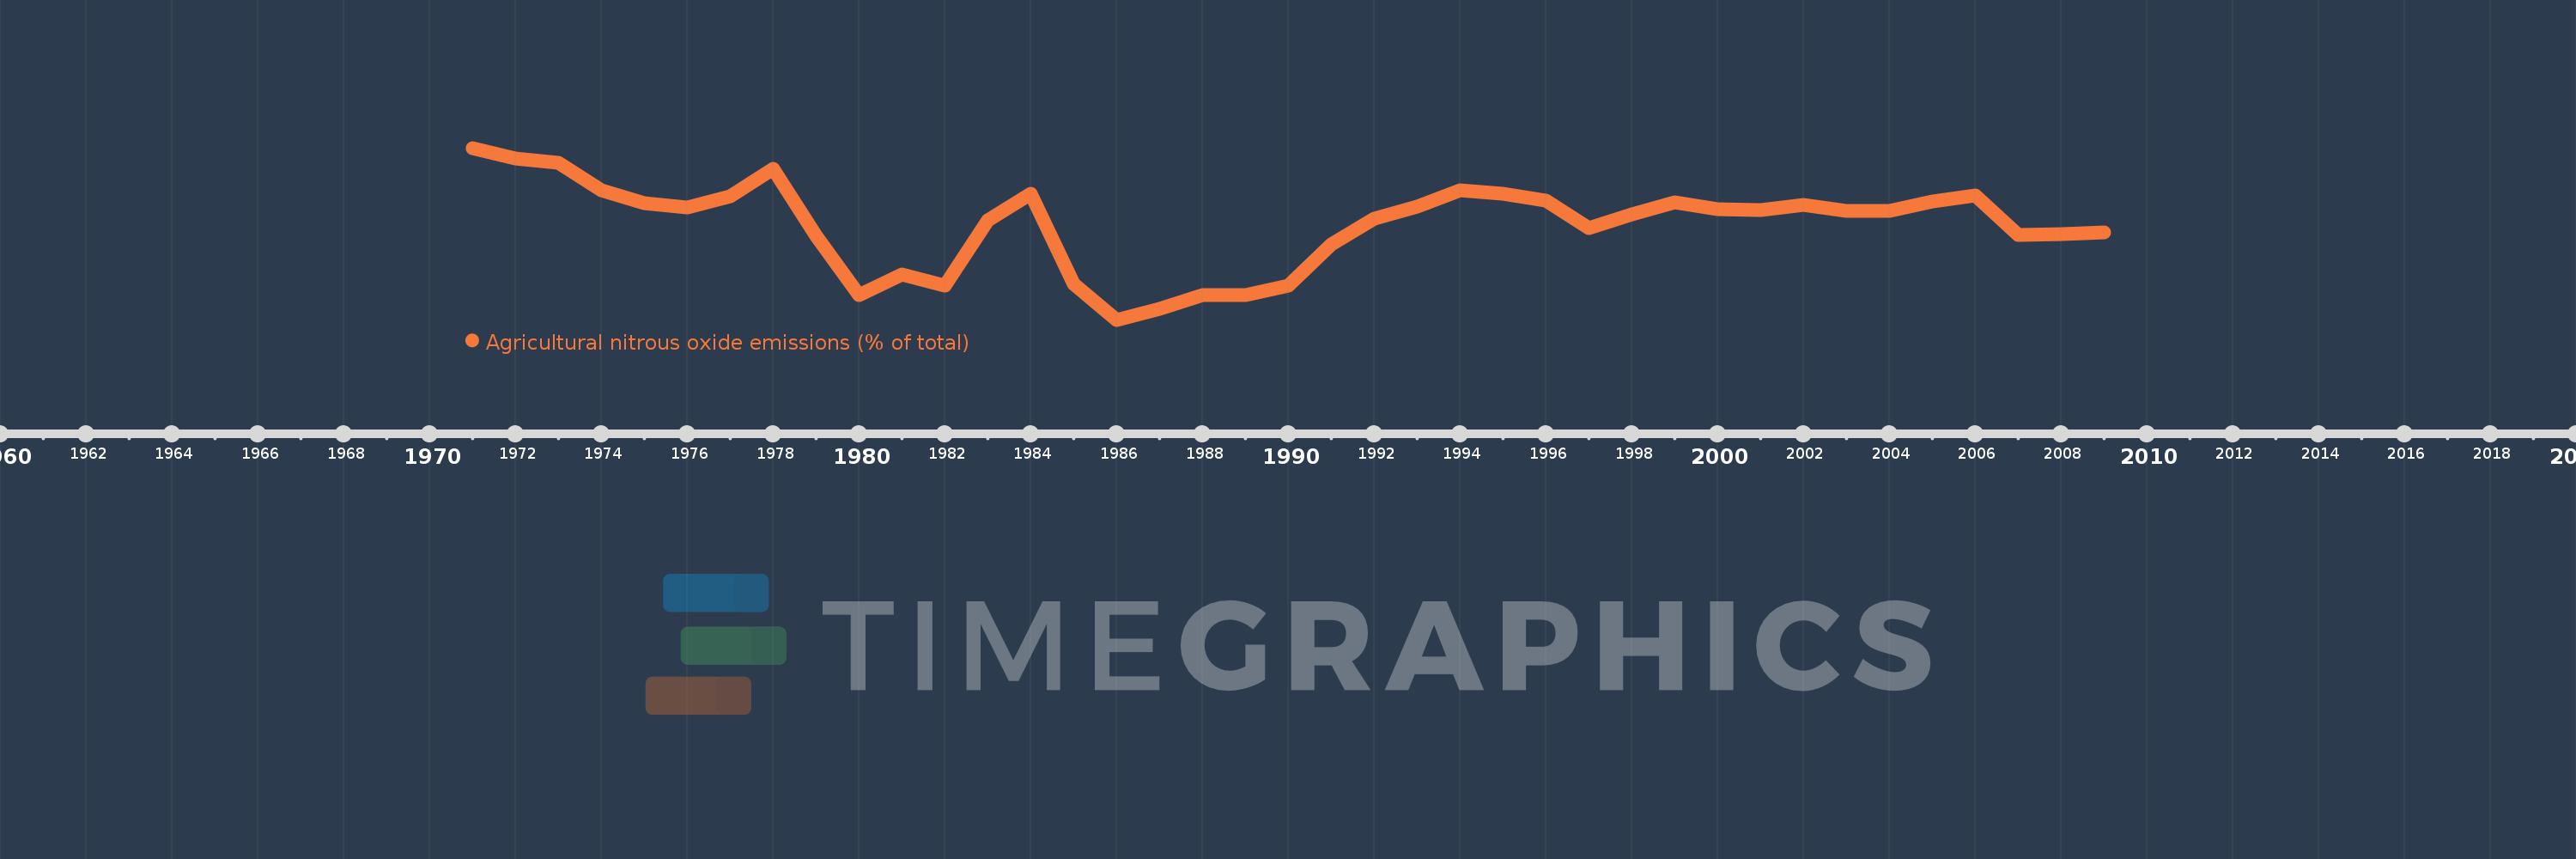
Agricultural nitrous oxide emissions (% of total)
2009,2008,2007,2006,2005,2004,2003,2002,2001,2000,1999,1998,1997,1996,1995,1994,1993,1992,1991,1990,1989,1988,1987,1986,1985,1984,1983,1982,1981,1980,1979,1978,1977,1976,1975,1974,1973,1972,1971
This statistics in other country:
AfghanistanAlbaniaAlgeriaAmerican SamoaAndorraAngolaAntigua and BarbudaArab WorldArgentinaArmeniaArubaAustraliaAustriaAzerbaijanBahamas, TheBahrainBangladeshBarbadosBelarusBelgiumBelizeBeninBermudaBhutanBoliviaBosnia and HerzegovinaBotswanaBrazilBritish Virgin IslandsBrunei DarussalamBulgariaBurkina FasoBurundiCabo VerdeCambodiaCameroonCanadaCaribbean small statesCayman IslandsCentral African RepublicCentral Europe and the BalticsChadChileChinaColombiaComorosCongo, Dem. Rep.Congo, Rep.Costa RicaCote d'IvoireCroatiaCubaCyprusCzech RepublicDenmarkDjiboutiDominicaDominican RepublicEarly-demographic dividendEast Asia & PacificEast Asia & Pacific (excluding high income)East Asia & Pacific (IDA & IBRD countries)EcuadorEgypt, Arab Rep.El SalvadorEquatorial GuineaEritreaEstoniaEthiopiaEuro areaEurope & Central AsiaEurope & Central Asia (excluding high income)Europe & Central Asia (IDA & IBRD countries)European UnionFaroe IslandsFijiFinlandFragile and conflict affected situationsFranceFrench PolynesiaGabonGambia, TheGeorgiaGermanyGhanaGibraltarGreeceGreenlandGrenadaGuamGuatemalaGuineaGuinea-BissauGuyanaHaitiHeavily indebted poor countries (HIPC)High incomeHondurasHong Kong SAR, ChinaHungaryIBRD onlyIcelandIDA & IBRD totalIDA blendIDA onlyIDA totalIndiaIndonesiaIran, Islamic Rep.IraqIrelandIsraelItalyJamaicaJapanJordanKazakhstanKenyaKiribatiKorea, Dem. People’s Rep.Korea, Rep.KuwaitKyrgyz RepublicLao PDRLate-demographic dividendLatin America & Caribbean Latin America & Caribbean (excluding high income)Latin America & the Caribbean (IDA & IBRD countries)LatviaLeast developed countries: UN classificationLebanonLesothoLiberiaLibyaLithuaniaLow & middle incomeLow incomeLower middle incomeLuxembourgMacao SAR, ChinaMacedonia, FYRMadagascarMalawiMalaysiaMaldivesMaliMaltaMarshall IslandsMauritaniaMauritiusMexicoMicronesia, Fed. Sts.Middle East & North AfricaMiddle East & North Africa (excluding high income)Middle East & North Africa (IDA & IBRD countries)Middle incomeMoldovaMongoliaMoroccoMozambiqueMyanmarNamibiaNauruNepalNetherlandsNew CaledoniaNew ZealandNicaraguaNigerNigeriaNorth AmericaNorthern Mariana IslandsNorwayOECD membersOmanOther small statesPacific island small statesPakistanPalauPanamaPapua New GuineaParaguayPeruPhilippinesPolandPortugalPost-demographic dividendPre-demographic dividendPuerto RicoQatarRomaniaRussian FederationRwandaSamoaSao Tome and PrincipeSaudi ArabiaSenegalSerbiaSeychellesSierra LeoneSingaporeSlovak RepublicSloveniaSmall statesSolomon IslandsSomaliaSouth AfricaSouth AsiaSouth Asia (IDA & IBRD)SpainSri LankaSt. Kitts and NevisSt. LuciaSt. Vincent and the GrenadinesSub-Saharan Africa Sub-Saharan Africa (excluding high income)Sub-Saharan Africa (IDA & IBRD countries)SudanSurinameSwazilandSwedenSwitzerlandSyrian Arab RepublicTajikistanTanzaniaThailandTimor-LesteTogoTongaTrinidad and TobagoTunisiaTurkeyTurkmenistanTurks and Caicos IslandsTuvaluUgandaUkraineUnited Arab EmiratesUnited KingdomUnited StatesUpper middle incomeUruguayUzbekistanVanuatuVenezuela, RBVietnamVirgin Islands (U.S.)WorldYemen, Rep.ZambiaZimbabwe Timeline:
This timeline shows a graph from 1971 to 2009 of Cuba. No data until 1970. Number of actual observations by date: 39.
Source name:
World Development Indicators
Source organization:
World Bank staff estimates from original source: European Commission, Joint Research Centre (JRC)/Netherlands Environmental Assessment Agency (PBL). Emission Database for Global Atmospheric Research (EDGAR): http://edgar.jrc.ec.europa.eu/.
Categories, topics:
Agriculture & Rural Development, Environment
Last updated:
apr 23, 2017
Indicators value changes by year
Maximum:
81.633
jan 1, 1971
At the date of observation
Value
Absolute change
Change from previous value
jan 1, 1971
81.633
+81.633
0.0%
jan 1, 1972
80.914
-0.719
-0.88%
jan 1, 1973
80.601
-0.314
-0.39%
jan 1, 1974
78.659
-1.942
-2.41%
jan 1, 1975
77.748
-0.911
-1.16%
jan 1, 1976
77.43
-0.318
-0.41%
jan 1, 1977
78.218
+0.788
1.02%
jan 1, 1978
80.172
+1.953
2.5%
jan 1, 1979
75.468
-4.703
-5.87%
jan 1, 1980
71.285
-4.183
-5.54%
jan 1, 1981
72.719
+1.434
2.01%
jan 1, 1982
71.952
-0.767
-1.05%
jan 1, 1983
76.519
+4.567
6.35%
jan 1, 1984
78.414
+1.895
2.48%
jan 1, 1985
72.024
-6.39
-8.15%
jan 1, 1986
69.53
-2.494
-3.46%
jan 1, 1987
70.279
+0.749
1.08%
jan 1, 1988
71.294
+1.015
1.44%
jan 1, 1989
71.271
-0.023
-0.03%
jan 1, 1990
71.943
+0.672
0.94%
jan 1, 1991
74.864
+2.921
4.06%
jan 1, 1992
76.636
+1.772
2.37%
jan 1, 1993
77.518
+0.882
1.15%
jan 1, 1994
78.65
+1.132
1.46%
jan 1, 1995
78.382
-0.269
-0.34%
jan 1, 1996
77.936
-0.446
-0.57%
jan 1, 1997
75.985
-1.951
-2.5%
jan 1, 1998
76.985
+1.0
1.32%
jan 1, 1999
77.817
+0.832
1.08%
jan 1, 2000
77.292
-0.525
-0.67%
jan 1, 2001
77.262
-0.03
-0.04%
jan 1, 2002
77.621
+0.359
0.46%
jan 1, 2003
77.168
-0.453
-0.58%
jan 1, 2004
77.168
0.0
0.0%
jan 1, 2005
77.833
+0.665
0.86%
jan 1, 2006
78.278
+0.446
0.57%
jan 1, 2007
75.51
-2.768
-3.54%
jan 1, 2008
75.579
+0.069
0.09%
jan 1, 2009
75.709
+0.13
0.17%
Ranking of countries by current statistics by years


Comments: