29
/
en
AIzaSyAYiBZKx7MnpbEhh9jyipgxe19OcubqV5w
April 1, 2024
110570
Congo, Rep.
COG
true
2
1
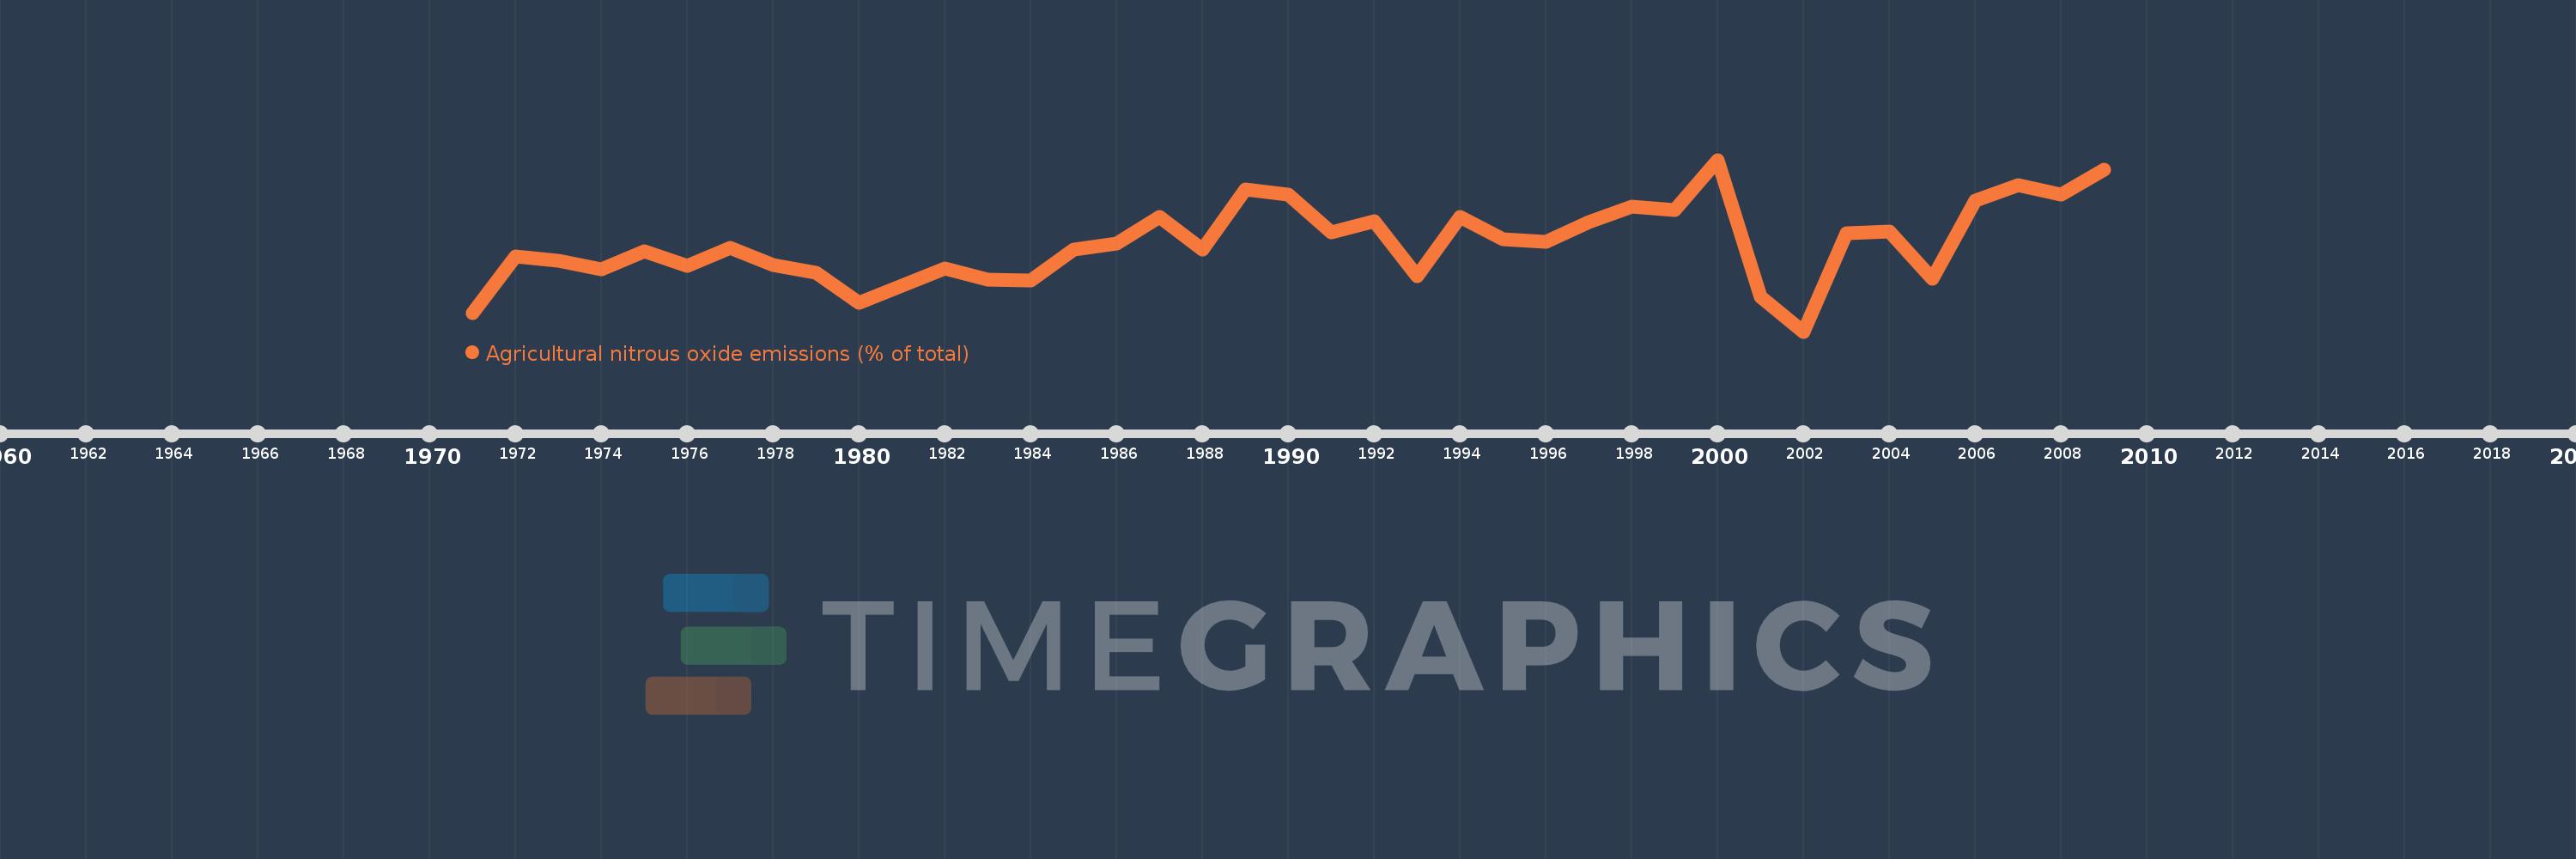
Agricultural nitrous oxide emissions (% of total)
2009,2008,2007,2006,2005,2004,2003,2002,2001,2000,1999,1998,1997,1996,1995,1994,1993,1992,1991,1990,1989,1988,1987,1986,1985,1984,1983,1982,1981,1980,1979,1978,1977,1976,1975,1974,1973,1972,1971
This statistics in other country:
AfghanistanAlbaniaAlgeriaAmerican SamoaAndorraAngolaAntigua and BarbudaArab WorldArgentinaArmeniaArubaAustraliaAustriaAzerbaijanBahamas, TheBahrainBangladeshBarbadosBelarusBelgiumBelizeBeninBermudaBhutanBoliviaBosnia and HerzegovinaBotswanaBrazilBritish Virgin IslandsBrunei DarussalamBulgariaBurkina FasoBurundiCabo VerdeCambodiaCameroonCanadaCaribbean small statesCayman IslandsCentral African RepublicCentral Europe and the BalticsChadChileChinaColombiaComorosCongo, Dem. Rep.Congo, Rep.Costa RicaCote d'IvoireCroatiaCubaCyprusCzech RepublicDenmarkDjiboutiDominicaDominican RepublicEarly-demographic dividendEast Asia & PacificEast Asia & Pacific (excluding high income)East Asia & Pacific (IDA & IBRD countries)EcuadorEgypt, Arab Rep.El SalvadorEquatorial GuineaEritreaEstoniaEthiopiaEuro areaEurope & Central AsiaEurope & Central Asia (excluding high income)Europe & Central Asia (IDA & IBRD countries)European UnionFaroe IslandsFijiFinlandFragile and conflict affected situationsFranceFrench PolynesiaGabonGambia, TheGeorgiaGermanyGhanaGibraltarGreeceGreenlandGrenadaGuamGuatemalaGuineaGuinea-BissauGuyanaHaitiHeavily indebted poor countries (HIPC)High incomeHondurasHong Kong SAR, ChinaHungaryIBRD onlyIcelandIDA & IBRD totalIDA blendIDA onlyIDA totalIndiaIndonesiaIran, Islamic Rep.IraqIrelandIsraelItalyJamaicaJapanJordanKazakhstanKenyaKiribatiKorea, Dem. People’s Rep.Korea, Rep.KuwaitKyrgyz RepublicLao PDRLate-demographic dividendLatin America & Caribbean Latin America & Caribbean (excluding high income)Latin America & the Caribbean (IDA & IBRD countries)LatviaLeast developed countries: UN classificationLebanonLesothoLiberiaLibyaLithuaniaLow & middle incomeLow incomeLower middle incomeLuxembourgMacao SAR, ChinaMacedonia, FYRMadagascarMalawiMalaysiaMaldivesMaliMaltaMarshall IslandsMauritaniaMauritiusMexicoMicronesia, Fed. Sts.Middle East & North AfricaMiddle East & North Africa (excluding high income)Middle East & North Africa (IDA & IBRD countries)Middle incomeMoldovaMongoliaMoroccoMozambiqueMyanmarNamibiaNauruNepalNetherlandsNew CaledoniaNew ZealandNicaraguaNigerNigeriaNorth AmericaNorthern Mariana IslandsNorwayOECD membersOmanOther small statesPacific island small statesPakistanPalauPanamaPapua New GuineaParaguayPeruPhilippinesPolandPortugalPost-demographic dividendPre-demographic dividendPuerto RicoQatarRomaniaRussian FederationRwandaSamoaSao Tome and PrincipeSaudi ArabiaSenegalSerbiaSeychellesSierra LeoneSingaporeSlovak RepublicSloveniaSmall statesSolomon IslandsSomaliaSouth AfricaSouth AsiaSouth Asia (IDA & IBRD)SpainSri LankaSt. Kitts and NevisSt. LuciaSt. Vincent and the GrenadinesSub-Saharan Africa Sub-Saharan Africa (excluding high income)Sub-Saharan Africa (IDA & IBRD countries)SudanSurinameSwazilandSwedenSwitzerlandSyrian Arab RepublicTajikistanTanzaniaThailandTimor-LesteTogoTongaTrinidad and TobagoTunisiaTurkeyTurkmenistanTurks and Caicos IslandsTuvaluUgandaUkraineUnited Arab EmiratesUnited KingdomUnited StatesUpper middle incomeUruguayUzbekistanVanuatuVenezuela, RBVietnamVirgin Islands (U.S.)WorldYemen, Rep.ZambiaZimbabwe Timeline:
This timeline shows a graph from 1971 to 2009 of Congo, Rep.. No data until 1970. Number of actual observations by date: 39.
Source name:
World Development Indicators
Source organization:
World Bank staff estimates from original source: European Commission, Joint Research Centre (JRC)/Netherlands Environmental Assessment Agency (PBL). Emission Database for Global Atmospheric Research (EDGAR): http://edgar.jrc.ec.europa.eu/.
Categories, topics:
Agriculture & Rural Development, Environment
Last updated:
apr 23, 2017
Indicators value changes by year
Minimum:
38.893
jan 1, 2002
Maximum:
53.586
jan 1, 2000
At the date of observation
Value
Absolute change
Change from previous value
jan 1, 1971
40.465
+40.465
0.0%
jan 1, 1972
45.325
+4.861
12.01%
jan 1, 1973
44.932
-0.393
-0.87%
jan 1, 1974
44.253
-0.679
-1.51%
jan 1, 1975
45.763
+1.51
3.41%
jan 1, 1976
44.528
-1.235
-2.7%
jan 1, 1977
46.053
+1.525
3.42%
jan 1, 1978
44.582
-1.471
-3.2%
jan 1, 1979
43.918
-0.664
-1.49%
jan 1, 1980
41.366
-2.552
-5.81%
jan 1, 1981
42.81
+1.444
3.49%
jan 1, 1982
44.28
+1.47
3.43%
jan 1, 1983
43.325
-0.954
-2.16%
jan 1, 1984
43.285
-0.041
-0.09%
jan 1, 1985
45.927
+2.643
6.11%
jan 1, 1986
46.452
+0.525
1.14%
jan 1, 1987
48.696
+2.244
4.83%
jan 1, 1988
45.919
-2.777
-5.7%
jan 1, 1989
51.039
+5.12
11.15%
jan 1, 1990
50.604
-0.435
-0.85%
jan 1, 1991
47.368
-3.236
-6.4%
jan 1, 1992
48.351
+0.984
2.08%
jan 1, 1993
43.653
-4.698
-9.72%
jan 1, 1994
48.732
+5.079
11.63%
jan 1, 1995
46.796
-1.936
-3.97%
jan 1, 1996
46.566
-0.23
-0.49%
jan 1, 1997
48.227
+1.661
3.57%
jan 1, 1998
49.546
+1.319
2.73%
jan 1, 1999
49.297
-0.249
-0.5%
jan 1, 2000
53.586
+4.29
8.7%
jan 1, 2001
41.904
-11.683
-21.8%
jan 1, 2002
38.893
-3.011
-7.18%
jan 1, 2003
47.292
+8.399
21.6%
jan 1, 2004
47.426
+0.133
0.28%
jan 1, 2005
43.444
-3.982
-8.4%
jan 1, 2006
50.129
+6.685
15.39%
jan 1, 2007
51.384
+1.255
2.5%
jan 1, 2008
50.634
-0.75
-1.46%
jan 1, 2009
52.748
+2.114
4.17%
Ranking of countries by current statistics by years


Comments: