29
/
en
AIzaSyAYiBZKx7MnpbEhh9jyipgxe19OcubqV5w
April 1, 2024
24665
Caribbean small states
CSS
false
2
1
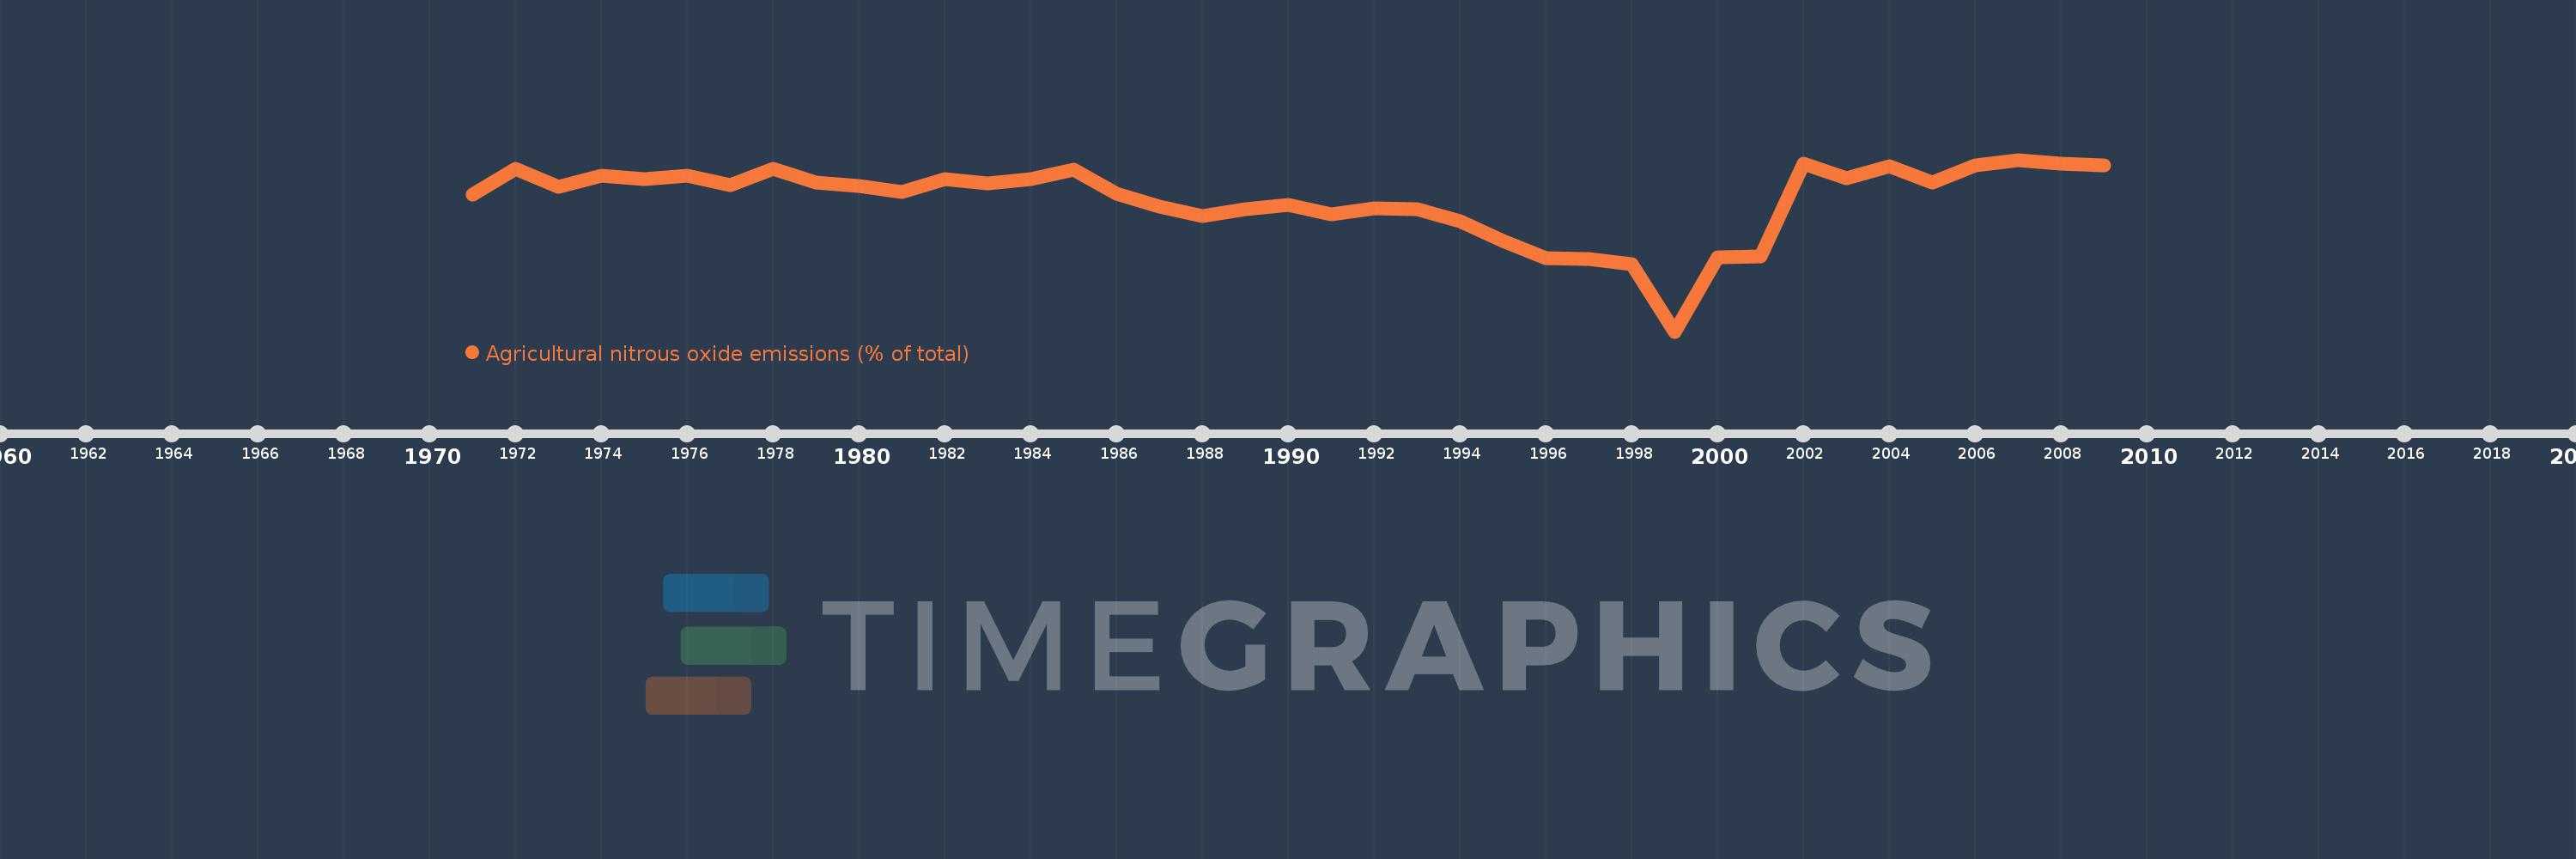
Agricultural nitrous oxide emissions (% of total)
2009,2008,2007,2006,2005,2004,2003,2002,2001,2000,1999,1998,1997,1996,1995,1994,1993,1992,1991,1990,1989,1988,1987,1986,1985,1984,1983,1982,1981,1980,1979,1978,1977,1976,1975,1974,1973,1972,1971
This statistics in other country:
AfghanistanAlbaniaAlgeriaAmerican SamoaAndorraAngolaAntigua and BarbudaArab WorldArgentinaArmeniaArubaAustraliaAustriaAzerbaijanBahamas, TheBahrainBangladeshBarbadosBelarusBelgiumBelizeBeninBermudaBhutanBoliviaBosnia and HerzegovinaBotswanaBrazilBritish Virgin IslandsBrunei DarussalamBulgariaBurkina FasoBurundiCabo VerdeCambodiaCameroonCanadaCaribbean small statesCayman IslandsCentral African RepublicCentral Europe and the BalticsChadChileChinaColombiaComorosCongo, Dem. Rep.Congo, Rep.Costa RicaCote d'IvoireCroatiaCubaCyprusCzech RepublicDenmarkDjiboutiDominicaDominican RepublicEarly-demographic dividendEast Asia & PacificEast Asia & Pacific (excluding high income)East Asia & Pacific (IDA & IBRD countries)EcuadorEgypt, Arab Rep.El SalvadorEquatorial GuineaEritreaEstoniaEthiopiaEuro areaEurope & Central AsiaEurope & Central Asia (excluding high income)Europe & Central Asia (IDA & IBRD countries)European UnionFaroe IslandsFijiFinlandFragile and conflict affected situationsFranceFrench PolynesiaGabonGambia, TheGeorgiaGermanyGhanaGibraltarGreeceGreenlandGrenadaGuamGuatemalaGuineaGuinea-BissauGuyanaHaitiHeavily indebted poor countries (HIPC)High incomeHondurasHong Kong SAR, ChinaHungaryIBRD onlyIcelandIDA & IBRD totalIDA blendIDA onlyIDA totalIndiaIndonesiaIran, Islamic Rep.IraqIrelandIsraelItalyJamaicaJapanJordanKazakhstanKenyaKiribatiKorea, Dem. People’s Rep.Korea, Rep.KuwaitKyrgyz RepublicLao PDRLate-demographic dividendLatin America & Caribbean Latin America & Caribbean (excluding high income)Latin America & the Caribbean (IDA & IBRD countries)LatviaLeast developed countries: UN classificationLebanonLesothoLiberiaLibyaLithuaniaLow & middle incomeLow incomeLower middle incomeLuxembourgMacao SAR, ChinaMacedonia, FYRMadagascarMalawiMalaysiaMaldivesMaliMaltaMarshall IslandsMauritaniaMauritiusMexicoMicronesia, Fed. Sts.Middle East & North AfricaMiddle East & North Africa (excluding high income)Middle East & North Africa (IDA & IBRD countries)Middle incomeMoldovaMongoliaMoroccoMozambiqueMyanmarNamibiaNauruNepalNetherlandsNew CaledoniaNew ZealandNicaraguaNigerNigeriaNorth AmericaNorthern Mariana IslandsNorwayOECD membersOmanOther small statesPacific island small statesPakistanPalauPanamaPapua New GuineaParaguayPeruPhilippinesPolandPortugalPost-demographic dividendPre-demographic dividendPuerto RicoQatarRomaniaRussian FederationRwandaSamoaSao Tome and PrincipeSaudi ArabiaSenegalSerbiaSeychellesSierra LeoneSingaporeSlovak RepublicSloveniaSmall statesSolomon IslandsSomaliaSouth AfricaSouth AsiaSouth Asia (IDA & IBRD)SpainSri LankaSt. Kitts and NevisSt. LuciaSt. Vincent and the GrenadinesSub-Saharan Africa Sub-Saharan Africa (excluding high income)Sub-Saharan Africa (IDA & IBRD countries)SudanSurinameSwazilandSwedenSwitzerlandSyrian Arab RepublicTajikistanTanzaniaThailandTimor-LesteTogoTongaTrinidad and TobagoTunisiaTurkeyTurkmenistanTurks and Caicos IslandsTuvaluUgandaUkraineUnited Arab EmiratesUnited KingdomUnited StatesUpper middle incomeUruguayUzbekistanVanuatuVenezuela, RBVietnamVirgin Islands (U.S.)WorldYemen, Rep.ZambiaZimbabwe Timeline:
This timeline shows a graph from 1971 to 2009 of Caribbean small states. No data until 1970. Number of actual observations by date: 39.
Source name:
World Development Indicators
Source organization:
World Bank staff estimates from original source: European Commission, Joint Research Centre (JRC)/Netherlands Environmental Assessment Agency (PBL). Emission Database for Global Atmospheric Research (EDGAR): http://edgar.jrc.ec.europa.eu/.
Categories, topics:
Agriculture & Rural Development, Environment
Last updated:
apr 23, 2017
Indicators value changes by year
Minimum:
44.158
jan 1, 1999
Maximum:
69.012
jan 1, 2007
At the date of observation
Value
Absolute change
Change from previous value
jan 1, 1971
63.943
+63.943
0.0%
jan 1, 1972
67.722
+3.779
5.91%
jan 1, 1973
65.131
-2.591
-3.83%
jan 1, 1974
66.677
+1.546
2.37%
jan 1, 1975
66.223
-0.454
-0.68%
jan 1, 1976
66.726
+0.502
0.76%
jan 1, 1977
65.372
-1.354
-2.03%
jan 1, 1978
67.718
+2.347
3.59%
jan 1, 1979
65.76
-1.959
-2.89%
jan 1, 1980
65.16
-0.6
-0.91%
jan 1, 1981
64.396
-0.764
-1.17%
jan 1, 1982
66.275
+1.879
2.92%
jan 1, 1983
65.636
-0.639
-0.96%
jan 1, 1984
66.243
+0.607
0.92%
jan 1, 1985
67.575
+1.332
2.01%
jan 1, 1986
64.046
-3.529
-5.22%
jan 1, 1987
62.22
-1.826
-2.85%
jan 1, 1988
60.93
-1.29
-2.07%
jan 1, 1989
61.868
+0.938
1.54%
jan 1, 1990
62.489
+0.621
1.0%
jan 1, 1991
61.097
-1.392
-2.23%
jan 1, 1992
61.959
+0.862
1.41%
jan 1, 1993
61.87
-0.088
-0.14%
jan 1, 1994
60.092
-1.778
-2.87%
jan 1, 1995
57.255
-2.837
-4.72%
jan 1, 1996
54.817
-2.438
-4.26%
jan 1, 1997
54.649
-0.168
-0.31%
jan 1, 1998
53.945
-0.704
-1.29%
jan 1, 1999
44.158
-9.788
-18.14%
jan 1, 2000
54.88
+10.722
24.28%
jan 1, 2001
55.071
+0.191
0.35%
jan 1, 2002
68.41
+13.339
24.22%
jan 1, 2003
66.321
-2.089
-3.05%
jan 1, 2004
68.13
+1.809
2.73%
jan 1, 2005
65.762
-2.369
-3.48%
jan 1, 2006
68.161
+2.4
3.65%
jan 1, 2007
69.012
+0.851
1.25%
jan 1, 2008
68.42
-0.593
-0.86%
jan 1, 2009
68.25
-0.17
-0.25%
Ranking of countries by current statistics by years


Comments: