29
/
en
AIzaSyAYiBZKx7MnpbEhh9jyipgxe19OcubqV5w
April 1, 2024
214999
Oman
OMN
true
2
1
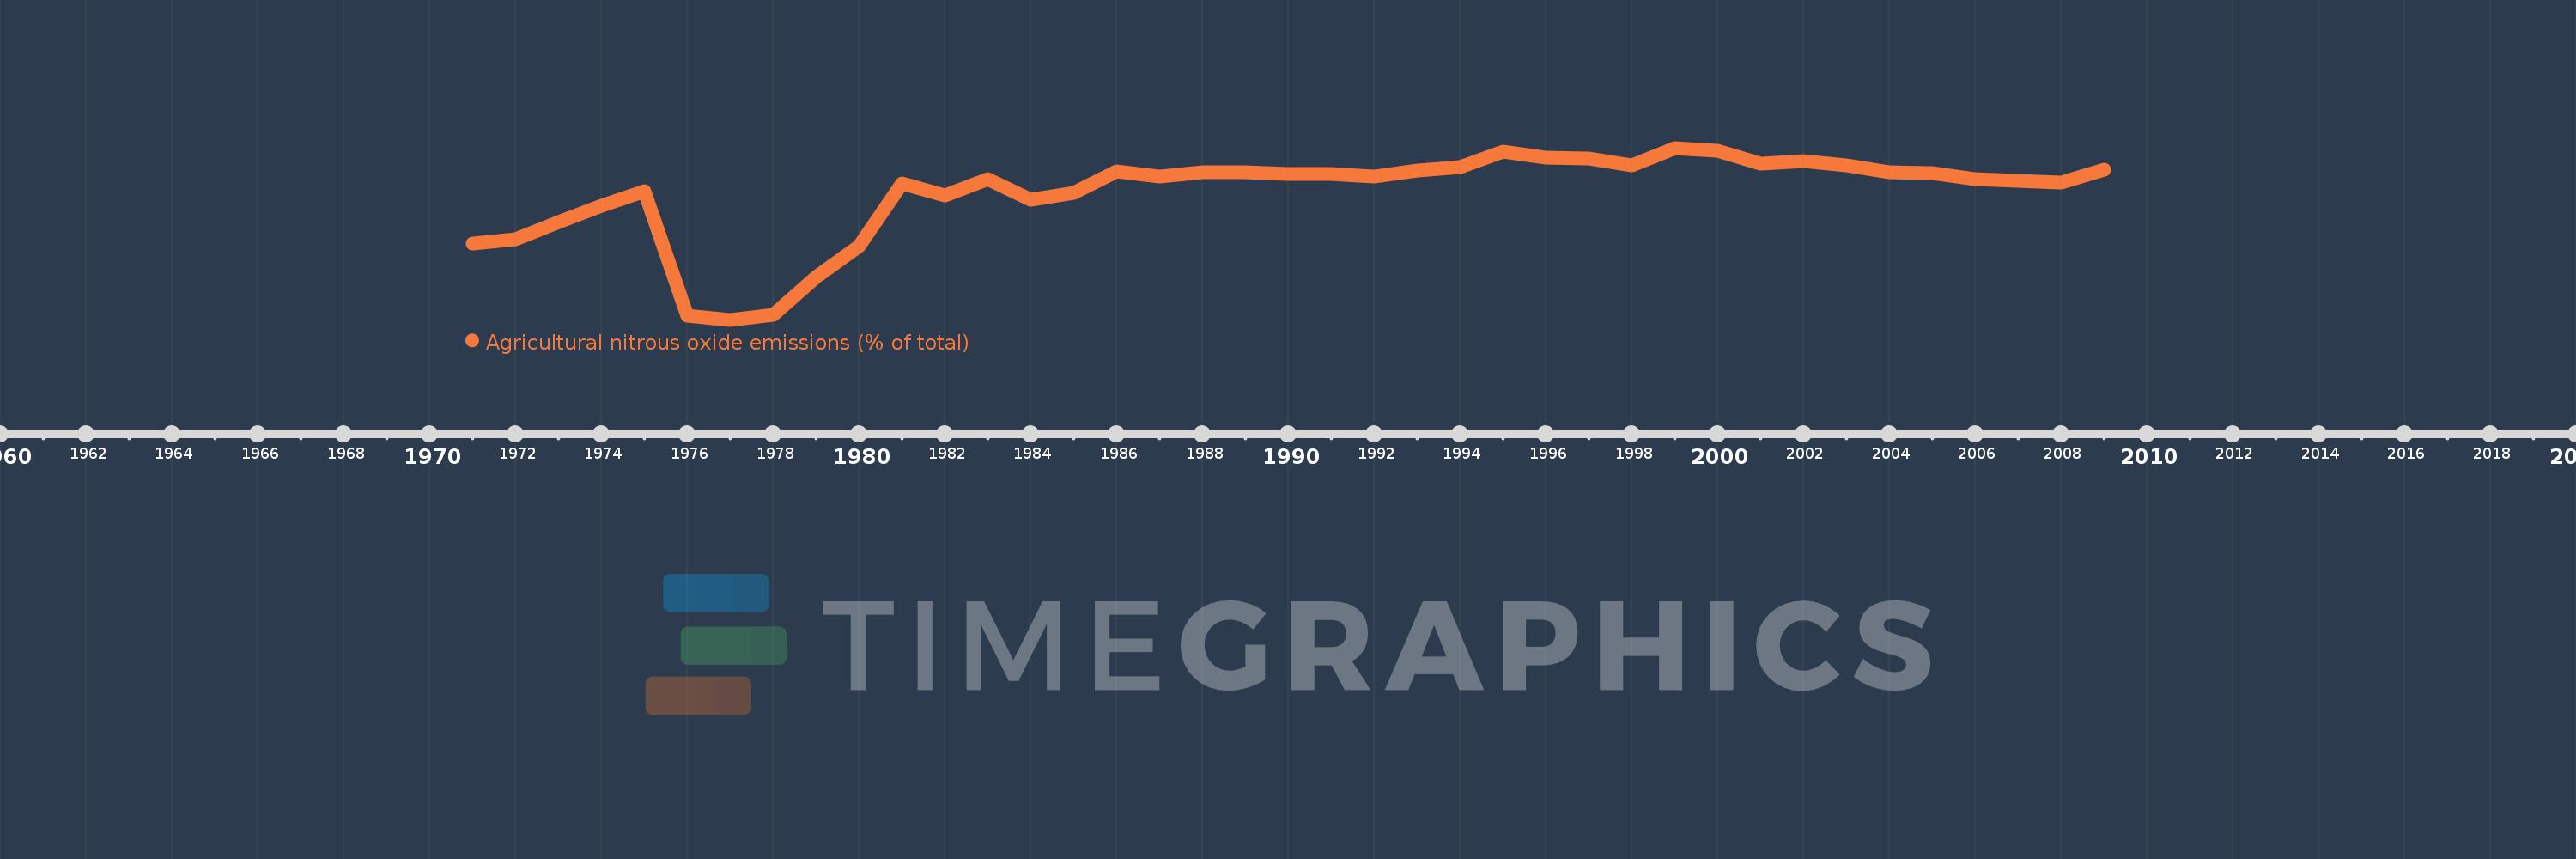
Agricultural nitrous oxide emissions (% of total)
2009,2008,2007,2006,2005,2004,2003,2002,2001,2000,1999,1998,1997,1996,1995,1994,1993,1992,1991,1990,1989,1988,1987,1986,1985,1984,1983,1982,1981,1980,1979,1978,1977,1976,1975,1974,1973,1972,1971
This statistics in other country:
AfghanistanAlbaniaAlgeriaAmerican SamoaAndorraAngolaAntigua and BarbudaArab WorldArgentinaArmeniaArubaAustraliaAustriaAzerbaijanBahamas, TheBahrainBangladeshBarbadosBelarusBelgiumBelizeBeninBermudaBhutanBoliviaBosnia and HerzegovinaBotswanaBrazilBritish Virgin IslandsBrunei DarussalamBulgariaBurkina FasoBurundiCabo VerdeCambodiaCameroonCanadaCaribbean small statesCayman IslandsCentral African RepublicCentral Europe and the BalticsChadChileChinaColombiaComorosCongo, Dem. Rep.Congo, Rep.Costa RicaCote d'IvoireCroatiaCubaCyprusCzech RepublicDenmarkDjiboutiDominicaDominican RepublicEarly-demographic dividendEast Asia & PacificEast Asia & Pacific (excluding high income)East Asia & Pacific (IDA & IBRD countries)EcuadorEgypt, Arab Rep.El SalvadorEquatorial GuineaEritreaEstoniaEthiopiaEuro areaEurope & Central AsiaEurope & Central Asia (excluding high income)Europe & Central Asia (IDA & IBRD countries)European UnionFaroe IslandsFijiFinlandFragile and conflict affected situationsFranceFrench PolynesiaGabonGambia, TheGeorgiaGermanyGhanaGibraltarGreeceGreenlandGrenadaGuamGuatemalaGuineaGuinea-BissauGuyanaHaitiHeavily indebted poor countries (HIPC)High incomeHondurasHong Kong SAR, ChinaHungaryIBRD onlyIcelandIDA & IBRD totalIDA blendIDA onlyIDA totalIndiaIndonesiaIran, Islamic Rep.IraqIrelandIsraelItalyJamaicaJapanJordanKazakhstanKenyaKiribatiKorea, Dem. People’s Rep.Korea, Rep.KuwaitKyrgyz RepublicLao PDRLate-demographic dividendLatin America & Caribbean Latin America & Caribbean (excluding high income)Latin America & the Caribbean (IDA & IBRD countries)LatviaLeast developed countries: UN classificationLebanonLesothoLiberiaLibyaLithuaniaLow & middle incomeLow incomeLower middle incomeLuxembourgMacao SAR, ChinaMacedonia, FYRMadagascarMalawiMalaysiaMaldivesMaliMaltaMarshall IslandsMauritaniaMauritiusMexicoMicronesia, Fed. Sts.Middle East & North AfricaMiddle East & North Africa (excluding high income)Middle East & North Africa (IDA & IBRD countries)Middle incomeMoldovaMongoliaMoroccoMozambiqueMyanmarNamibiaNauruNepalNetherlandsNew CaledoniaNew ZealandNicaraguaNigerNigeriaNorth AmericaNorthern Mariana IslandsNorwayOECD membersOmanOther small statesPacific island small statesPakistanPalauPanamaPapua New GuineaParaguayPeruPhilippinesPolandPortugalPost-demographic dividendPre-demographic dividendPuerto RicoQatarRomaniaRussian FederationRwandaSamoaSao Tome and PrincipeSaudi ArabiaSenegalSerbiaSeychellesSierra LeoneSingaporeSlovak RepublicSloveniaSmall statesSolomon IslandsSomaliaSouth AfricaSouth AsiaSouth Asia (IDA & IBRD)SpainSri LankaSt. Kitts and NevisSt. LuciaSt. Vincent and the GrenadinesSub-Saharan Africa Sub-Saharan Africa (excluding high income)Sub-Saharan Africa (IDA & IBRD countries)SudanSurinameSwazilandSwedenSwitzerlandSyrian Arab RepublicTajikistanTanzaniaThailandTimor-LesteTogoTongaTrinidad and TobagoTunisiaTurkeyTurkmenistanTurks and Caicos IslandsTuvaluUgandaUkraineUnited Arab EmiratesUnited KingdomUnited StatesUpper middle incomeUruguayUzbekistanVanuatuVenezuela, RBVietnamVirgin Islands (U.S.)WorldYemen, Rep.ZambiaZimbabwe Timeline:
This timeline shows a graph from 1971 to 2009 of Oman. No data until 1970. Number of actual observations by date: 39.
Source name:
World Development Indicators
Source organization:
World Bank staff estimates from original source: European Commission, Joint Research Centre (JRC)/Netherlands Environmental Assessment Agency (PBL). Emission Database for Global Atmospheric Research (EDGAR): http://edgar.jrc.ec.europa.eu/.
Categories, topics:
Agriculture & Rural Development, Environment
Last updated:
apr 23, 2017
Indicators value changes by year
Minimum:
38.042
jan 1, 1977
Maximum:
61.455
jan 1, 1999
At the date of observation
Value
Absolute change
Change from previous value
jan 1, 1971
48.397
+48.397
0.0%
jan 1, 1972
49.022
+0.626
1.29%
jan 1, 1973
51.377
+2.355
4.8%
jan 1, 1974
53.598
+2.221
4.32%
jan 1, 1975
55.509
+1.911
3.57%
jan 1, 1976
38.595
-16.913
-30.47%
jan 1, 1977
38.042
-0.553
-1.43%
jan 1, 1978
38.752
+0.71
1.87%
jan 1, 1979
43.877
+5.125
13.23%
jan 1, 1980
48.027
+4.15
9.46%
jan 1, 1981
56.566
+8.539
17.78%
jan 1, 1982
55.035
-1.531
-2.71%
jan 1, 1983
57.171
+2.136
3.88%
jan 1, 1984
54.426
-2.746
-4.8%
jan 1, 1985
55.283
+0.858
1.58%
jan 1, 1986
58.269
+2.986
5.4%
jan 1, 1987
57.524
-0.745
-1.28%
jan 1, 1988
58.163
+0.639
1.11%
jan 1, 1989
58.1
-0.063
-0.11%
jan 1, 1990
57.927
-0.173
-0.3%
jan 1, 1991
57.964
+0.037
0.06%
jan 1, 1992
57.607
-0.357
-0.62%
jan 1, 1993
58.387
+0.78
1.35%
jan 1, 1994
58.826
+0.438
0.75%
jan 1, 1995
61.005
+2.179
3.7%
jan 1, 1996
60.116
-0.889
-1.46%
jan 1, 1997
59.985
-0.13
-0.22%
jan 1, 1998
59.04
-0.946
-1.58%
jan 1, 1999
61.455
+2.415
4.09%
jan 1, 2000
61.026
-0.429
-0.7%
jan 1, 2001
59.363
-1.663
-2.73%
jan 1, 2002
59.698
+0.336
0.57%
jan 1, 2003
59.073
-0.626
-1.05%
jan 1, 2004
58.188
-0.884
-1.5%
jan 1, 2005
57.984
-0.204
-0.35%
jan 1, 2006
57.224
-0.76
-1.31%
jan 1, 2007
56.914
-0.309
-0.54%
jan 1, 2008
56.706
-0.208
-0.37%
jan 1, 2009
58.458
+1.752
3.09%
Ranking of countries by current statistics by years


Comments: