29
/
en
AIzaSyAYiBZKx7MnpbEhh9jyipgxe19OcubqV5w
April 1, 2024
252680
Sudan
SDN
true
2
1
Agricultural nitrous oxide emissions (% of total)
2009,2008,2007,2006,2005,2004,2003,2002,2001,2000,1999,1998,1997,1996,1995,1994,1993,1992,1991,1990,1989,1988,1987,1986,1985,1984,1983,1982,1981,1980,1979,1978,1977,1976,1975,1974,1973,1972,1971
This statistics in other country:
AfghanistanAlbaniaAlgeriaAmerican SamoaAndorraAngolaAntigua and BarbudaArab WorldArgentinaArmeniaArubaAustraliaAustriaAzerbaijanBahamas, TheBahrainBangladeshBarbadosBelarusBelgiumBelizeBeninBermudaBhutanBoliviaBosnia and HerzegovinaBotswanaBrazilBritish Virgin IslandsBrunei DarussalamBulgariaBurkina FasoBurundiCabo VerdeCambodiaCameroonCanadaCaribbean small statesCayman IslandsCentral African RepublicCentral Europe and the BalticsChadChileChinaColombiaComorosCongo, Dem. Rep.Congo, Rep.Costa RicaCote d'IvoireCroatiaCubaCyprusCzech RepublicDenmarkDjiboutiDominicaDominican RepublicEarly-demographic dividendEast Asia & PacificEast Asia & Pacific (excluding high income)East Asia & Pacific (IDA & IBRD countries)EcuadorEgypt, Arab Rep.El SalvadorEquatorial GuineaEritreaEstoniaEthiopiaEuro areaEurope & Central AsiaEurope & Central Asia (excluding high income)Europe & Central Asia (IDA & IBRD countries)European UnionFaroe IslandsFijiFinlandFragile and conflict affected situationsFranceFrench PolynesiaGabonGambia, TheGeorgiaGermanyGhanaGibraltarGreeceGreenlandGrenadaGuamGuatemalaGuineaGuinea-BissauGuyanaHaitiHeavily indebted poor countries (HIPC)High incomeHondurasHong Kong SAR, ChinaHungaryIBRD onlyIcelandIDA & IBRD totalIDA blendIDA onlyIDA totalIndiaIndonesiaIran, Islamic Rep.IraqIrelandIsraelItalyJamaicaJapanJordanKazakhstanKenyaKiribatiKorea, Dem. People’s Rep.Korea, Rep.KuwaitKyrgyz RepublicLao PDRLate-demographic dividendLatin America & Caribbean Latin America & Caribbean (excluding high income)Latin America & the Caribbean (IDA & IBRD countries)LatviaLeast developed countries: UN classificationLebanonLesothoLiberiaLibyaLithuaniaLow & middle incomeLow incomeLower middle incomeLuxembourgMacao SAR, ChinaMacedonia, FYRMadagascarMalawiMalaysiaMaldivesMaliMaltaMarshall IslandsMauritaniaMauritiusMexicoMicronesia, Fed. Sts.Middle East & North AfricaMiddle East & North Africa (excluding high income)Middle East & North Africa (IDA & IBRD countries)Middle incomeMoldovaMongoliaMoroccoMozambiqueMyanmarNamibiaNauruNepalNetherlandsNew CaledoniaNew ZealandNicaraguaNigerNigeriaNorth AmericaNorthern Mariana IslandsNorwayOECD membersOmanOther small statesPacific island small statesPakistanPalauPanamaPapua New GuineaParaguayPeruPhilippinesPolandPortugalPost-demographic dividendPre-demographic dividendPuerto RicoQatarRomaniaRussian FederationRwandaSamoaSao Tome and PrincipeSaudi ArabiaSenegalSerbiaSeychellesSierra LeoneSingaporeSlovak RepublicSloveniaSmall statesSolomon IslandsSomaliaSouth AfricaSouth AsiaSouth Asia (IDA & IBRD)SpainSri LankaSt. Kitts and NevisSt. LuciaSt. Vincent and the GrenadinesSub-Saharan Africa Sub-Saharan Africa (excluding high income)Sub-Saharan Africa (IDA & IBRD countries)SudanSurinameSwazilandSwedenSwitzerlandSyrian Arab RepublicTajikistanTanzaniaThailandTimor-LesteTogoTongaTrinidad and TobagoTunisiaTurkeyTurkmenistanTurks and Caicos IslandsTuvaluUgandaUkraineUnited Arab EmiratesUnited KingdomUnited StatesUpper middle incomeUruguayUzbekistanVanuatuVenezuela, RBVietnamVirgin Islands (U.S.)WorldYemen, Rep.ZambiaZimbabwe Timeline:
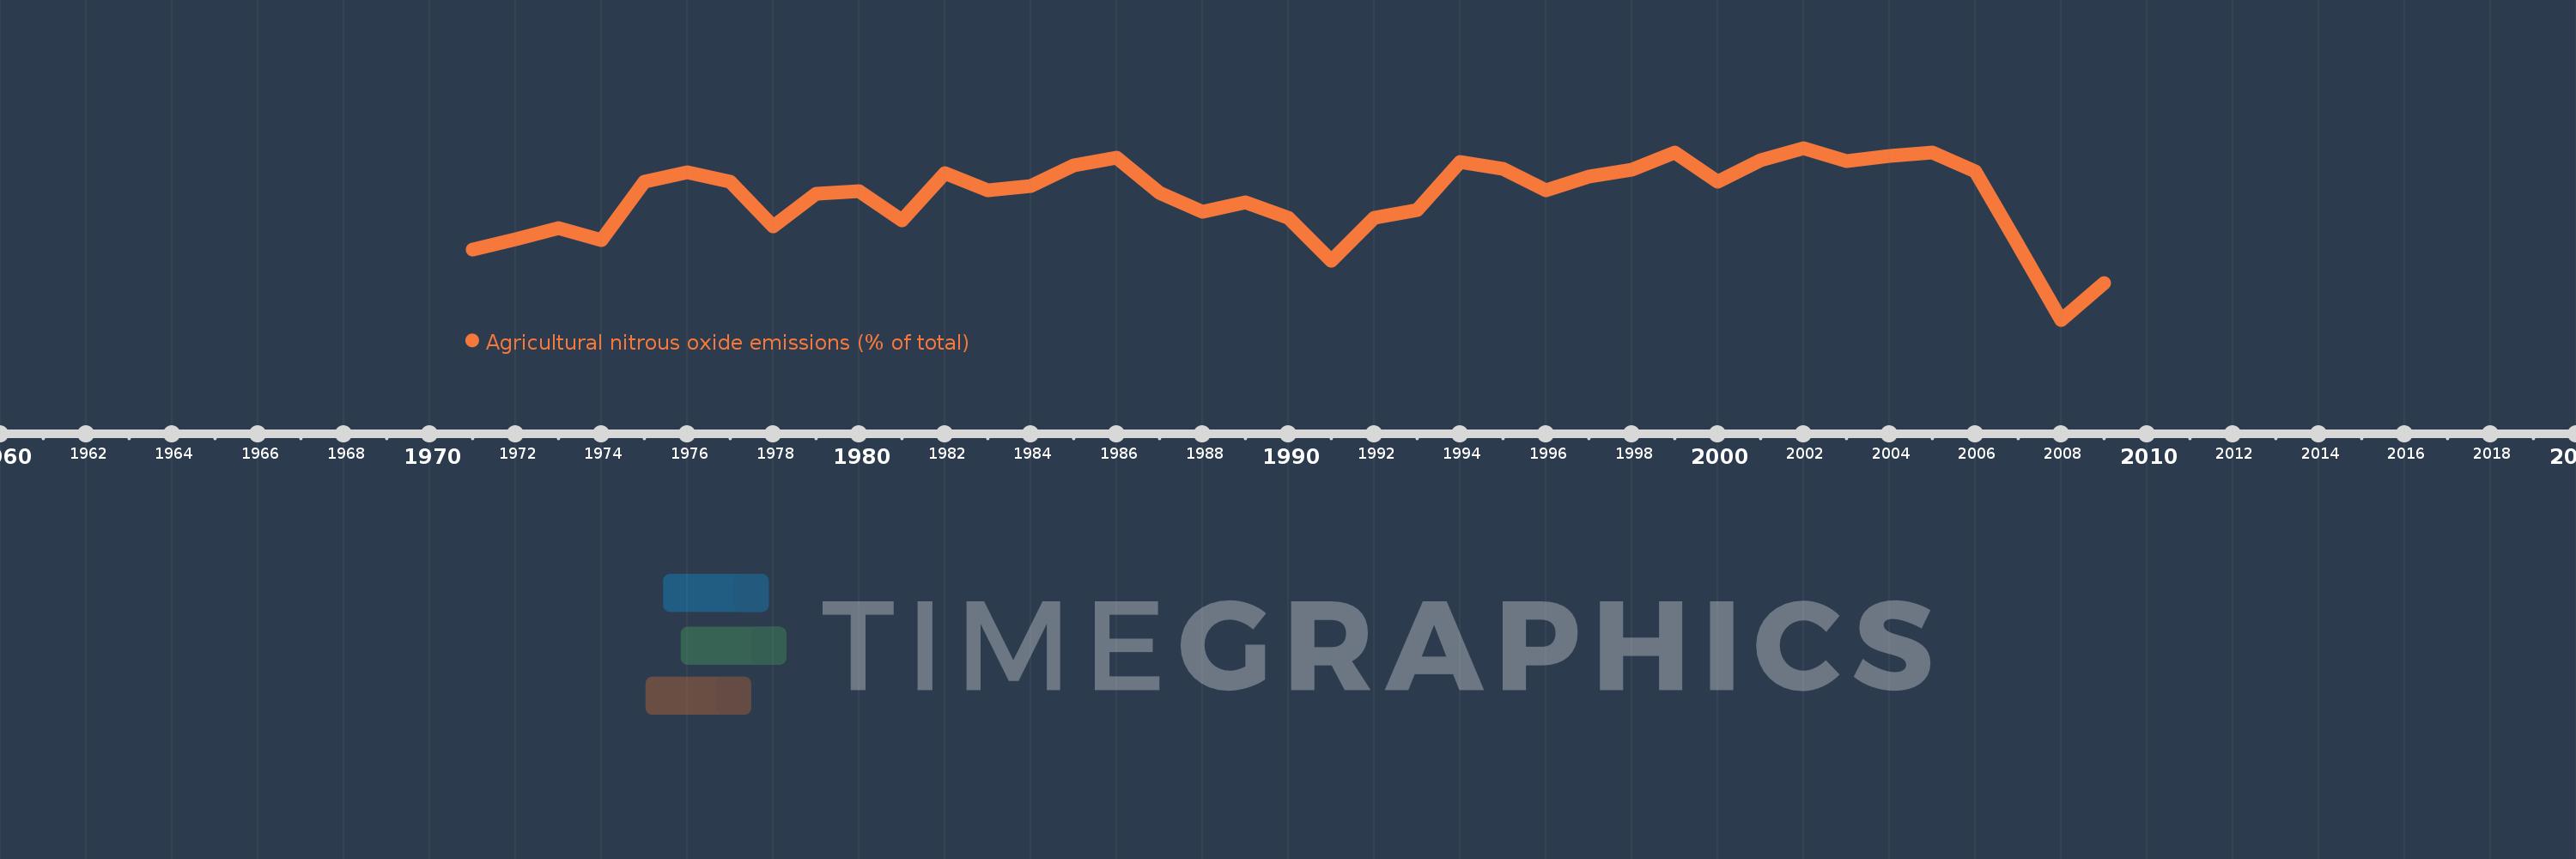
This timeline shows a graph from 1971 to 2009 of Sudan. No data until 1970. Number of actual observations by date: 39.
Source name:
World Development Indicators
Source organization:
World Bank staff estimates from original source: European Commission, Joint Research Centre (JRC)/Netherlands Environmental Assessment Agency (PBL). Emission Database for Global Atmospheric Research (EDGAR): http://edgar.jrc.ec.europa.eu/.
Categories, topics:
Agriculture & Rural Development, Environment
Last updated:
apr 23, 2017
Indicators value changes by year
Minimum:
90.319
jan 1, 2008
Maximum:
92.226
jan 1, 2002
At the date of observation
Value
Absolute change
Change from previous value
jan 1, 1971
91.1
+91.1
0.0%
jan 1, 1972
91.211
+0.112
0.12%
jan 1, 1973
91.337
+0.126
0.14%
jan 1, 1974
91.201
-0.136
-0.15%
jan 1, 1975
91.85
+0.649
0.71%
jan 1, 1976
91.956
+0.106
0.12%
jan 1, 1977
91.853
-0.103
-0.11%
jan 1, 1978
91.353
-0.5
-0.54%
jan 1, 1979
91.721
+0.368
0.4%
jan 1, 1980
91.744
+0.023
0.02%
jan 1, 1981
91.42
-0.324
-0.35%
jan 1, 1982
91.947
+0.527
0.58%
jan 1, 1983
91.756
-0.192
-0.21%
jan 1, 1984
91.801
+0.045
0.05%
jan 1, 1985
92.032
+0.232
0.25%
jan 1, 1986
92.115
+0.083
0.09%
jan 1, 1987
91.731
-0.384
-0.42%
jan 1, 1988
91.513
-0.218
-0.24%
jan 1, 1989
91.621
+0.108
0.12%
jan 1, 1990
91.447
-0.175
-0.19%
jan 1, 1991
90.974
-0.473
-0.52%
jan 1, 1992
91.453
+0.479
0.53%
jan 1, 1993
91.538
+0.085
0.09%
jan 1, 1994
92.069
+0.531
0.58%
jan 1, 1995
91.993
-0.076
-0.08%
jan 1, 1996
91.752
-0.241
-0.26%
jan 1, 1997
91.912
+0.16
0.17%
jan 1, 1998
91.984
+0.072
0.08%
jan 1, 1999
92.172
+0.188
0.2%
jan 1, 2000
91.856
-0.316
-0.34%
jan 1, 2001
92.093
+0.237
0.26%
jan 1, 2002
92.226
+0.133
0.14%
jan 1, 2003
92.078
-0.148
-0.16%
jan 1, 2004
92.141
+0.063
0.07%
jan 1, 2005
92.176
+0.035
0.04%
jan 1, 2006
91.963
-0.214
-0.23%
jan 1, 2007
91.149
-0.814
-0.88%
jan 1, 2008
90.319
-0.83
-0.91%
jan 1, 2009
90.727
+0.407
0.45%
Ranking of countries by current statistics by years


Comments: