29
/
en
AIzaSyAYiBZKx7MnpbEhh9jyipgxe19OcubqV5w
April 1, 2024
28866
East Asia & Pacific (IDA & IBRD countries)
TEA
false
2
1
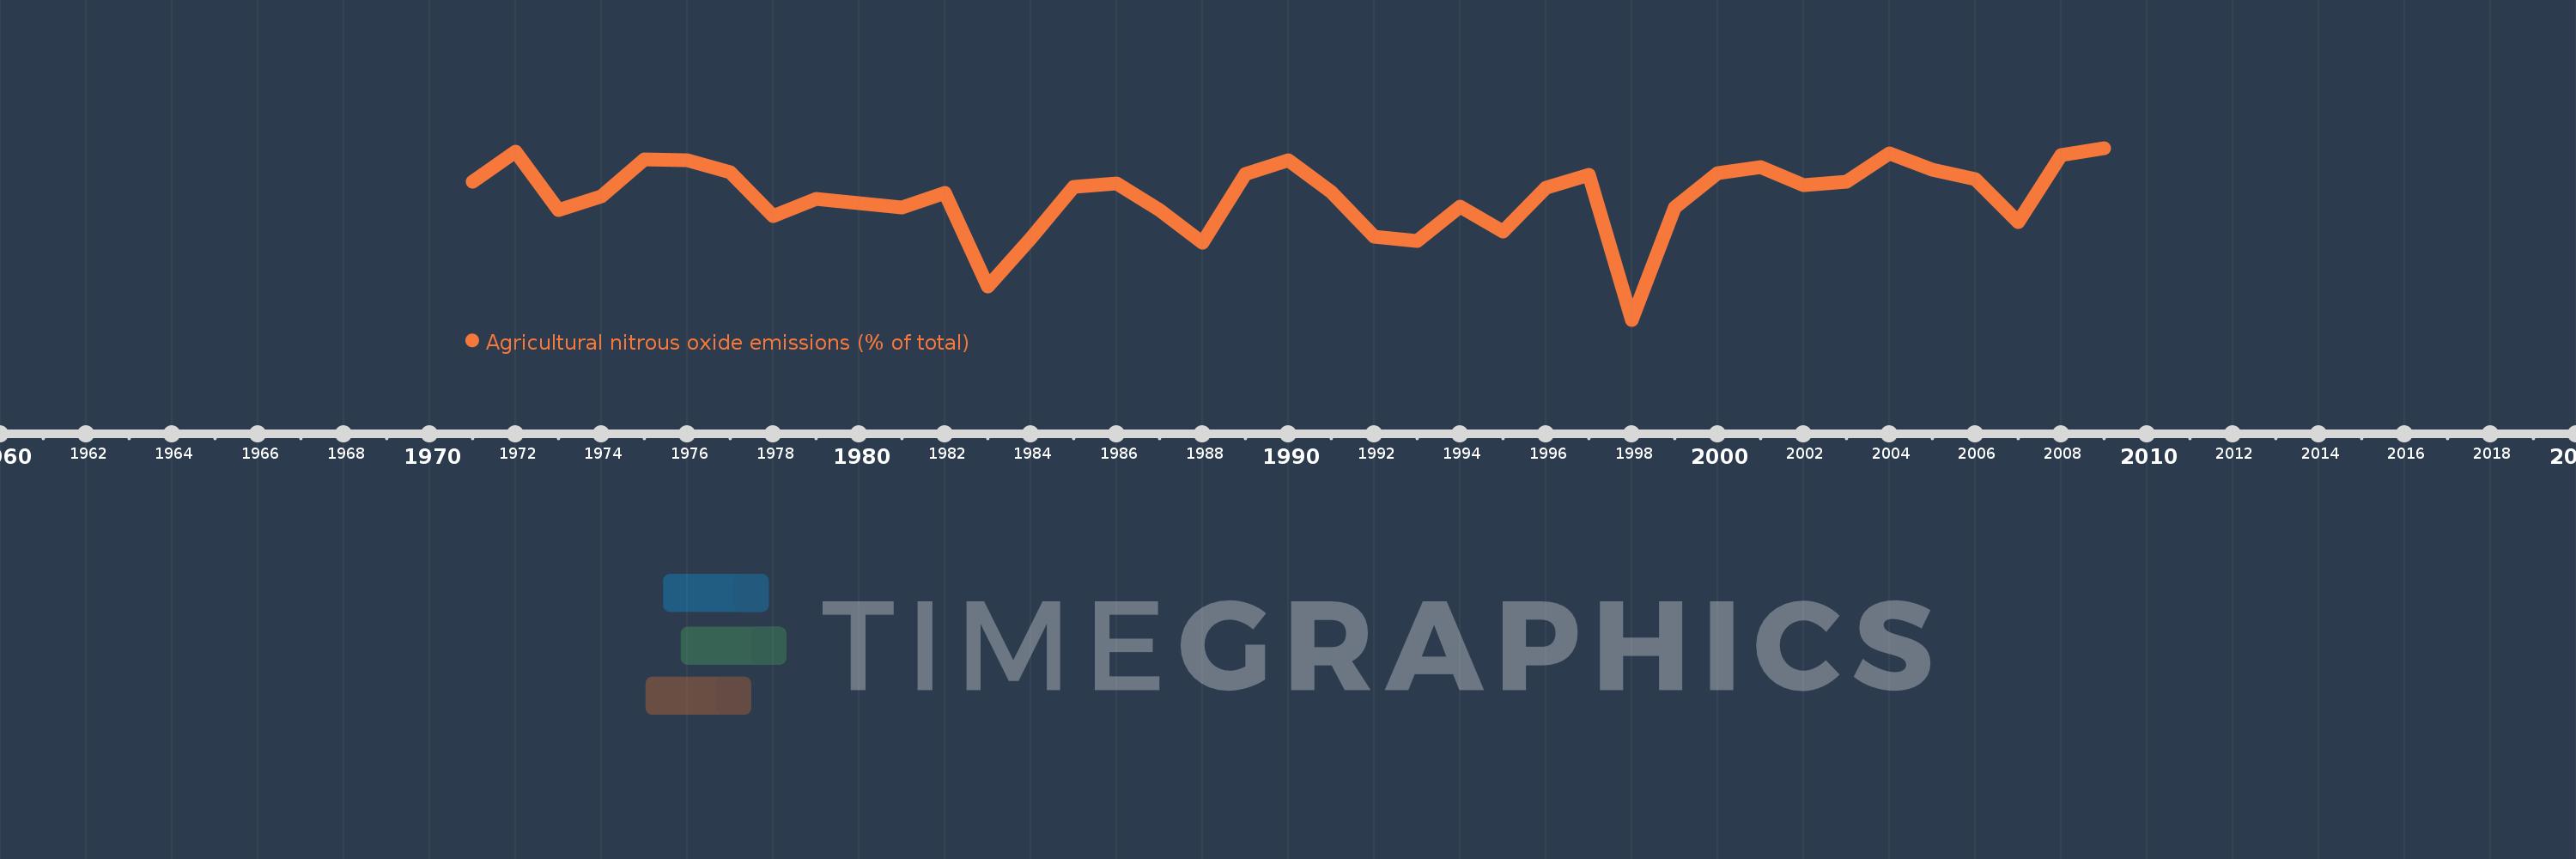
Agricultural nitrous oxide emissions (% of total)
2009,2008,2007,2006,2005,2004,2003,2002,2001,2000,1999,1998,1997,1996,1995,1994,1993,1992,1991,1990,1989,1988,1987,1986,1985,1984,1983,1982,1981,1980,1979,1978,1977,1976,1975,1974,1973,1972,1971
This statistics in other country:
AfghanistanAlbaniaAlgeriaAmerican SamoaAndorraAngolaAntigua and BarbudaArab WorldArgentinaArmeniaArubaAustraliaAustriaAzerbaijanBahamas, TheBahrainBangladeshBarbadosBelarusBelgiumBelizeBeninBermudaBhutanBoliviaBosnia and HerzegovinaBotswanaBrazilBritish Virgin IslandsBrunei DarussalamBulgariaBurkina FasoBurundiCabo VerdeCambodiaCameroonCanadaCaribbean small statesCayman IslandsCentral African RepublicCentral Europe and the BalticsChadChileChinaColombiaComorosCongo, Dem. Rep.Congo, Rep.Costa RicaCote d'IvoireCroatiaCubaCyprusCzech RepublicDenmarkDjiboutiDominicaDominican RepublicEarly-demographic dividendEast Asia & PacificEast Asia & Pacific (excluding high income)East Asia & Pacific (IDA & IBRD countries)EcuadorEgypt, Arab Rep.El SalvadorEquatorial GuineaEritreaEstoniaEthiopiaEuro areaEurope & Central AsiaEurope & Central Asia (excluding high income)Europe & Central Asia (IDA & IBRD countries)European UnionFaroe IslandsFijiFinlandFragile and conflict affected situationsFranceFrench PolynesiaGabonGambia, TheGeorgiaGermanyGhanaGibraltarGreeceGreenlandGrenadaGuamGuatemalaGuineaGuinea-BissauGuyanaHaitiHeavily indebted poor countries (HIPC)High incomeHondurasHong Kong SAR, ChinaHungaryIBRD onlyIcelandIDA & IBRD totalIDA blendIDA onlyIDA totalIndiaIndonesiaIran, Islamic Rep.IraqIrelandIsraelItalyJamaicaJapanJordanKazakhstanKenyaKiribatiKorea, Dem. People’s Rep.Korea, Rep.KuwaitKyrgyz RepublicLao PDRLate-demographic dividendLatin America & Caribbean Latin America & Caribbean (excluding high income)Latin America & the Caribbean (IDA & IBRD countries)LatviaLeast developed countries: UN classificationLebanonLesothoLiberiaLibyaLithuaniaLow & middle incomeLow incomeLower middle incomeLuxembourgMacao SAR, ChinaMacedonia, FYRMadagascarMalawiMalaysiaMaldivesMaliMaltaMarshall IslandsMauritaniaMauritiusMexicoMicronesia, Fed. Sts.Middle East & North AfricaMiddle East & North Africa (excluding high income)Middle East & North Africa (IDA & IBRD countries)Middle incomeMoldovaMongoliaMoroccoMozambiqueMyanmarNamibiaNauruNepalNetherlandsNew CaledoniaNew ZealandNicaraguaNigerNigeriaNorth AmericaNorthern Mariana IslandsNorwayOECD membersOmanOther small statesPacific island small statesPakistanPalauPanamaPapua New GuineaParaguayPeruPhilippinesPolandPortugalPost-demographic dividendPre-demographic dividendPuerto RicoQatarRomaniaRussian FederationRwandaSamoaSao Tome and PrincipeSaudi ArabiaSenegalSerbiaSeychellesSierra LeoneSingaporeSlovak RepublicSloveniaSmall statesSolomon IslandsSomaliaSouth AfricaSouth AsiaSouth Asia (IDA & IBRD)SpainSri LankaSt. Kitts and NevisSt. LuciaSt. Vincent and the GrenadinesSub-Saharan Africa Sub-Saharan Africa (excluding high income)Sub-Saharan Africa (IDA & IBRD countries)SudanSurinameSwazilandSwedenSwitzerlandSyrian Arab RepublicTajikistanTanzaniaThailandTimor-LesteTogoTongaTrinidad and TobagoTunisiaTurkeyTurkmenistanTurks and Caicos IslandsTuvaluUgandaUkraineUnited Arab EmiratesUnited KingdomUnited StatesUpper middle incomeUruguayUzbekistanVanuatuVenezuela, RBVietnamVirgin Islands (U.S.)WorldYemen, Rep.ZambiaZimbabwe Timeline:
This timeline shows a graph from 1971 to 2009 of East Asia & Pacific (IDA & IBRD countries). No data until 1970. Number of actual observations by date: 39.
Source name:
World Development Indicators
Source organization:
World Bank staff estimates from original source: European Commission, Joint Research Centre (JRC)/Netherlands Environmental Assessment Agency (PBL). Emission Database for Global Atmospheric Research (EDGAR): http://edgar.jrc.ec.europa.eu/.
Categories, topics:
Agriculture & Rural Development, Environment
Last updated:
apr 23, 2017
Indicators value changes by year
Minimum:
48.321
jan 1, 1998
Maximum:
72.446
jan 1, 2009
At the date of observation
Value
Absolute change
Change from previous value
jan 1, 1971
67.704
+67.704
0.0%
jan 1, 1972
71.969
+4.265
6.3%
jan 1, 1973
63.729
-8.24
-11.45%
jan 1, 1974
65.595
+1.867
2.93%
jan 1, 1975
70.87
+5.274
8.04%
jan 1, 1976
70.696
-0.174
-0.25%
jan 1, 1977
69.079
-1.617
-2.29%
jan 1, 1978
62.891
-6.188
-8.96%
jan 1, 1979
65.235
+2.344
3.73%
jan 1, 1980
64.691
-0.544
-0.83%
jan 1, 1981
64.102
-0.588
-0.91%
jan 1, 1982
66.127
+2.025
3.16%
jan 1, 1983
52.991
-13.137
-19.87%
jan 1, 1984
59.765
+6.774
12.78%
jan 1, 1985
66.975
+7.21
12.06%
jan 1, 1986
67.459
+0.484
0.72%
jan 1, 1987
63.667
-3.792
-5.62%
jan 1, 1988
59.172
-4.495
-7.06%
jan 1, 1989
68.799
+9.628
16.27%
jan 1, 1990
70.774
+1.974
2.87%
jan 1, 1991
66.297
-4.476
-6.32%
jan 1, 1992
59.995
-6.302
-9.51%
jan 1, 1993
59.393
-0.602
-1.0%
jan 1, 1994
64.199
+4.806
8.09%
jan 1, 1995
60.707
-3.492
-5.44%
jan 1, 1996
66.907
+6.2
10.21%
jan 1, 1997
68.73
+1.823
2.72%
jan 1, 1998
48.321
-20.409
-29.69%
jan 1, 1999
64.075
+15.754
32.6%
jan 1, 2000
68.911
+4.836
7.55%
jan 1, 2001
69.799
+0.888
1.29%
jan 1, 2002
67.26
-2.539
-3.64%
jan 1, 2003
67.674
+0.414
0.62%
jan 1, 2004
71.652
+3.978
5.88%
jan 1, 2005
69.365
-2.288
-3.19%
jan 1, 2006
68.119
-1.245
-1.8%
jan 1, 2007
62.007
-6.112
-8.97%
jan 1, 2008
71.431
+9.424
15.2%
jan 1, 2009
72.446
+1.015
1.42%
Ranking of countries by current statistics by years


Comments: