29
/
en
AIzaSyAYiBZKx7MnpbEhh9jyipgxe19OcubqV5w
April 1, 2024
187441
Malaysia
MYS
true
2
1
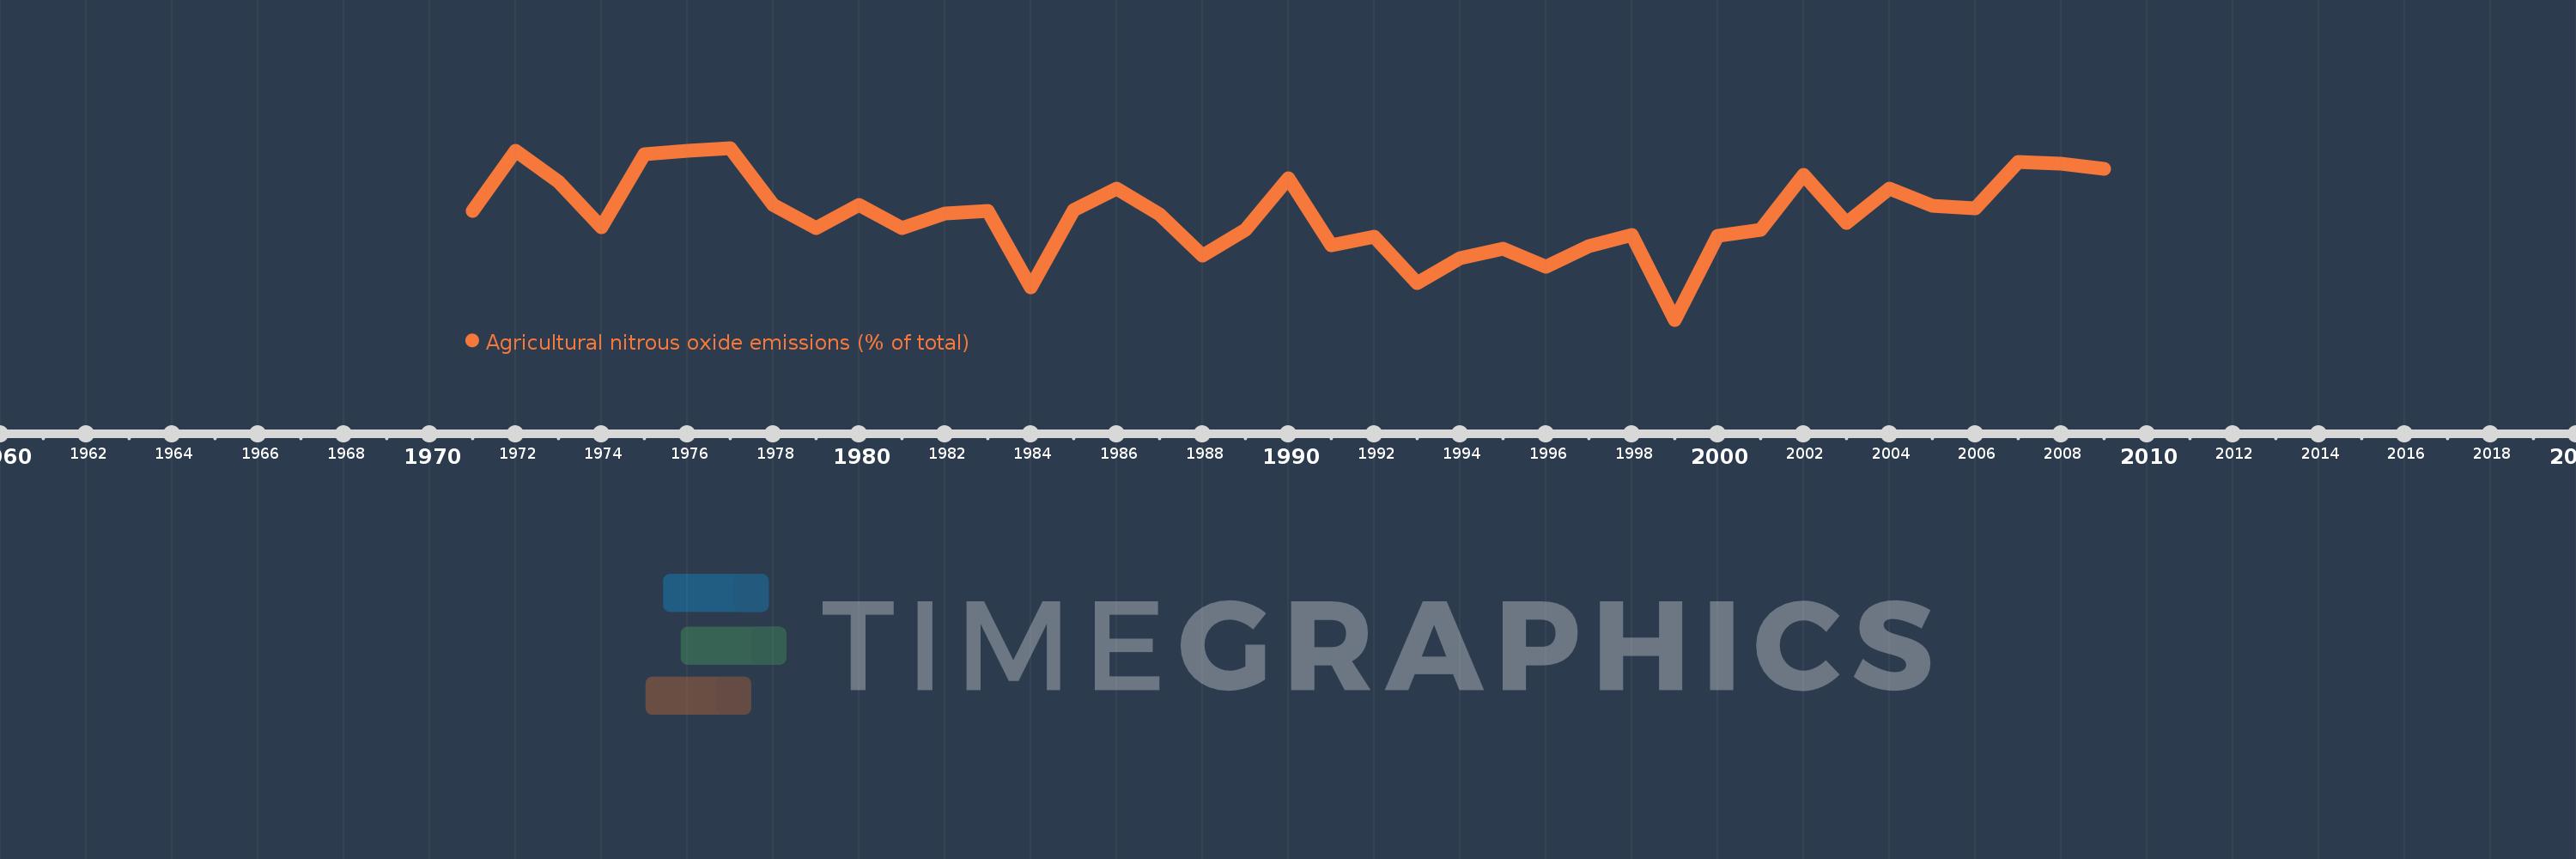
Agricultural nitrous oxide emissions (% of total)
2009,2008,2007,2006,2005,2004,2003,2002,2001,2000,1999,1998,1997,1996,1995,1994,1993,1992,1991,1990,1989,1988,1987,1986,1985,1984,1983,1982,1981,1980,1979,1978,1977,1976,1975,1974,1973,1972,1971
This statistics in other country:
AfghanistanAlbaniaAlgeriaAmerican SamoaAndorraAngolaAntigua and BarbudaArab WorldArgentinaArmeniaArubaAustraliaAustriaAzerbaijanBahamas, TheBahrainBangladeshBarbadosBelarusBelgiumBelizeBeninBermudaBhutanBoliviaBosnia and HerzegovinaBotswanaBrazilBritish Virgin IslandsBrunei DarussalamBulgariaBurkina FasoBurundiCabo VerdeCambodiaCameroonCanadaCaribbean small statesCayman IslandsCentral African RepublicCentral Europe and the BalticsChadChileChinaColombiaComorosCongo, Dem. Rep.Congo, Rep.Costa RicaCote d'IvoireCroatiaCubaCyprusCzech RepublicDenmarkDjiboutiDominicaDominican RepublicEarly-demographic dividendEast Asia & PacificEast Asia & Pacific (excluding high income)East Asia & Pacific (IDA & IBRD countries)EcuadorEgypt, Arab Rep.El SalvadorEquatorial GuineaEritreaEstoniaEthiopiaEuro areaEurope & Central AsiaEurope & Central Asia (excluding high income)Europe & Central Asia (IDA & IBRD countries)European UnionFaroe IslandsFijiFinlandFragile and conflict affected situationsFranceFrench PolynesiaGabonGambia, TheGeorgiaGermanyGhanaGibraltarGreeceGreenlandGrenadaGuamGuatemalaGuineaGuinea-BissauGuyanaHaitiHeavily indebted poor countries (HIPC)High incomeHondurasHong Kong SAR, ChinaHungaryIBRD onlyIcelandIDA & IBRD totalIDA blendIDA onlyIDA totalIndiaIndonesiaIran, Islamic Rep.IraqIrelandIsraelItalyJamaicaJapanJordanKazakhstanKenyaKiribatiKorea, Dem. People’s Rep.Korea, Rep.KuwaitKyrgyz RepublicLao PDRLate-demographic dividendLatin America & Caribbean Latin America & Caribbean (excluding high income)Latin America & the Caribbean (IDA & IBRD countries)LatviaLeast developed countries: UN classificationLebanonLesothoLiberiaLibyaLithuaniaLow & middle incomeLow incomeLower middle incomeLuxembourgMacao SAR, ChinaMacedonia, FYRMadagascarMalawiMalaysiaMaldivesMaliMaltaMarshall IslandsMauritaniaMauritiusMexicoMicronesia, Fed. Sts.Middle East & North AfricaMiddle East & North Africa (excluding high income)Middle East & North Africa (IDA & IBRD countries)Middle incomeMoldovaMongoliaMoroccoMozambiqueMyanmarNamibiaNauruNepalNetherlandsNew CaledoniaNew ZealandNicaraguaNigerNigeriaNorth AmericaNorthern Mariana IslandsNorwayOECD membersOmanOther small statesPacific island small statesPakistanPalauPanamaPapua New GuineaParaguayPeruPhilippinesPolandPortugalPost-demographic dividendPre-demographic dividendPuerto RicoQatarRomaniaRussian FederationRwandaSamoaSao Tome and PrincipeSaudi ArabiaSenegalSerbiaSeychellesSierra LeoneSingaporeSlovak RepublicSloveniaSmall statesSolomon IslandsSomaliaSouth AfricaSouth AsiaSouth Asia (IDA & IBRD)SpainSri LankaSt. Kitts and NevisSt. LuciaSt. Vincent and the GrenadinesSub-Saharan Africa Sub-Saharan Africa (excluding high income)Sub-Saharan Africa (IDA & IBRD countries)SudanSurinameSwazilandSwedenSwitzerlandSyrian Arab RepublicTajikistanTanzaniaThailandTimor-LesteTogoTongaTrinidad and TobagoTunisiaTurkeyTurkmenistanTurks and Caicos IslandsTuvaluUgandaUkraineUnited Arab EmiratesUnited KingdomUnited StatesUpper middle incomeUruguayUzbekistanVanuatuVenezuela, RBVietnamVirgin Islands (U.S.)WorldYemen, Rep.ZambiaZimbabwe Timeline:
This timeline shows a graph from 1971 to 2009 of Malaysia. No data until 1970. Number of actual observations by date: 39.
Source name:
World Development Indicators
Source organization:
World Bank staff estimates from original source: European Commission, Joint Research Centre (JRC)/Netherlands Environmental Assessment Agency (PBL). Emission Database for Global Atmospheric Research (EDGAR): http://edgar.jrc.ec.europa.eu/.
Categories, topics:
Agriculture & Rural Development, Environment
Last updated:
apr 23, 2017
Indicators value changes by year
Minimum:
49.008
jan 1, 1999
Maximum:
71.557
jan 1, 1977
At the date of observation
Value
Absolute change
Change from previous value
jan 1, 1971
63.255
+63.255
0.0%
jan 1, 1972
71.239
+7.983
12.62%
jan 1, 1973
67.12
-4.119
-5.78%
jan 1, 1974
61.174
-5.946
-8.86%
jan 1, 1975
70.726
+9.552
15.61%
jan 1, 1976
71.207
+0.481
0.68%
jan 1, 1977
71.557
+0.35
0.49%
jan 1, 1978
64.096
-7.461
-10.43%
jan 1, 1979
61.065
-3.031
-4.73%
jan 1, 1980
64.033
+2.969
4.86%
jan 1, 1981
60.982
-3.051
-4.76%
jan 1, 1982
62.987
+2.005
3.29%
jan 1, 1983
63.319
+0.332
0.53%
jan 1, 1984
53.254
-10.065
-15.9%
jan 1, 1985
63.413
+10.159
19.08%
jan 1, 1986
66.256
+2.843
4.48%
jan 1, 1987
62.838
-3.417
-5.16%
jan 1, 1988
57.389
-5.45
-8.67%
jan 1, 1989
60.864
+3.476
6.06%
jan 1, 1990
67.57
+6.706
11.02%
jan 1, 1991
58.775
-8.795
-13.02%
jan 1, 1992
59.88
+1.106
1.88%
jan 1, 1993
53.847
-6.033
-10.08%
jan 1, 1994
57.062
+3.215
5.97%
jan 1, 1995
58.328
+1.266
2.22%
jan 1, 1996
55.965
-2.363
-4.05%
jan 1, 1997
58.642
+2.677
4.78%
jan 1, 1998
60.179
+1.537
2.62%
jan 1, 1999
49.008
-11.171
-18.56%
jan 1, 2000
60.034
+11.026
22.5%
jan 1, 2001
60.797
+0.764
1.27%
jan 1, 2002
68.032
+7.234
11.9%
jan 1, 2003
61.768
-6.264
-9.21%
jan 1, 2004
66.228
+4.461
7.22%
jan 1, 2005
63.944
-2.285
-3.45%
jan 1, 2006
63.609
-0.335
-0.52%
jan 1, 2007
69.693
+6.084
9.56%
jan 1, 2008
69.546
-0.146
-0.21%
jan 1, 2009
68.788
-0.758
-1.09%
Ranking of countries by current statistics by years


Comments: