29
/
en
AIzaSyAYiBZKx7MnpbEhh9jyipgxe19OcubqV5w
April 1, 2024
81474
Belgium
BEL
true
2
1
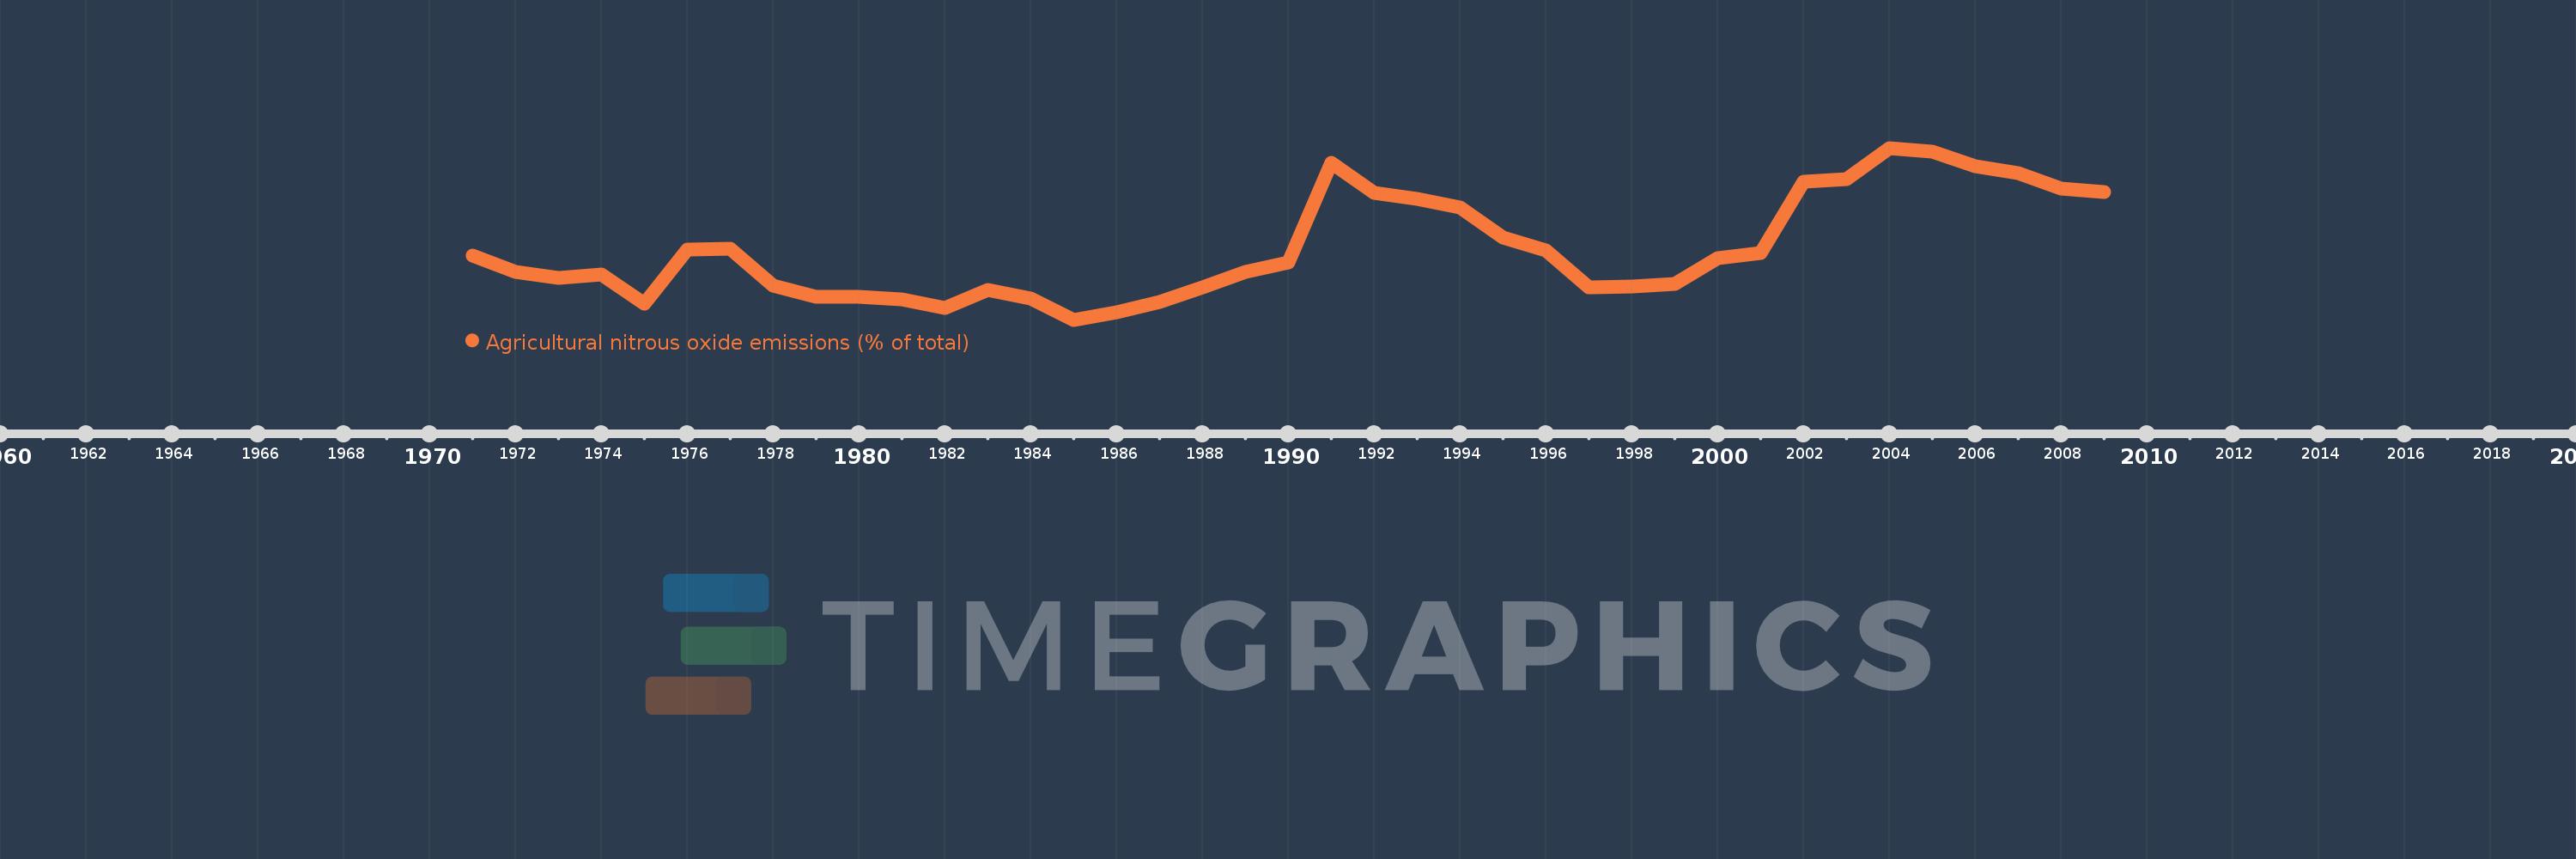
Agricultural nitrous oxide emissions (% of total)
2009,2008,2007,2006,2005,2004,2003,2002,2001,2000,1999,1998,1997,1996,1995,1994,1993,1992,1991,1990,1989,1988,1987,1986,1985,1984,1983,1982,1981,1980,1979,1978,1977,1976,1975,1974,1973,1972,1971
This statistics in other country:
AfghanistanAlbaniaAlgeriaAmerican SamoaAndorraAngolaAntigua and BarbudaArab WorldArgentinaArmeniaArubaAustraliaAustriaAzerbaijanBahamas, TheBahrainBangladeshBarbadosBelarusBelgiumBelizeBeninBermudaBhutanBoliviaBosnia and HerzegovinaBotswanaBrazilBritish Virgin IslandsBrunei DarussalamBulgariaBurkina FasoBurundiCabo VerdeCambodiaCameroonCanadaCaribbean small statesCayman IslandsCentral African RepublicCentral Europe and the BalticsChadChileChinaColombiaComorosCongo, Dem. Rep.Congo, Rep.Costa RicaCote d'IvoireCroatiaCubaCyprusCzech RepublicDenmarkDjiboutiDominicaDominican RepublicEarly-demographic dividendEast Asia & PacificEast Asia & Pacific (excluding high income)East Asia & Pacific (IDA & IBRD countries)EcuadorEgypt, Arab Rep.El SalvadorEquatorial GuineaEritreaEstoniaEthiopiaEuro areaEurope & Central AsiaEurope & Central Asia (excluding high income)Europe & Central Asia (IDA & IBRD countries)European UnionFaroe IslandsFijiFinlandFragile and conflict affected situationsFranceFrench PolynesiaGabonGambia, TheGeorgiaGermanyGhanaGibraltarGreeceGreenlandGrenadaGuamGuatemalaGuineaGuinea-BissauGuyanaHaitiHeavily indebted poor countries (HIPC)High incomeHondurasHong Kong SAR, ChinaHungaryIBRD onlyIcelandIDA & IBRD totalIDA blendIDA onlyIDA totalIndiaIndonesiaIran, Islamic Rep.IraqIrelandIsraelItalyJamaicaJapanJordanKazakhstanKenyaKiribatiKorea, Dem. People’s Rep.Korea, Rep.KuwaitKyrgyz RepublicLao PDRLate-demographic dividendLatin America & Caribbean Latin America & Caribbean (excluding high income)Latin America & the Caribbean (IDA & IBRD countries)LatviaLeast developed countries: UN classificationLebanonLesothoLiberiaLibyaLithuaniaLow & middle incomeLow incomeLower middle incomeLuxembourgMacao SAR, ChinaMacedonia, FYRMadagascarMalawiMalaysiaMaldivesMaliMaltaMarshall IslandsMauritaniaMauritiusMexicoMicronesia, Fed. Sts.Middle East & North AfricaMiddle East & North Africa (excluding high income)Middle East & North Africa (IDA & IBRD countries)Middle incomeMoldovaMongoliaMoroccoMozambiqueMyanmarNamibiaNauruNepalNetherlandsNew CaledoniaNew ZealandNicaraguaNigerNigeriaNorth AmericaNorthern Mariana IslandsNorwayOECD membersOmanOther small statesPacific island small statesPakistanPalauPanamaPapua New GuineaParaguayPeruPhilippinesPolandPortugalPost-demographic dividendPre-demographic dividendPuerto RicoQatarRomaniaRussian FederationRwandaSamoaSao Tome and PrincipeSaudi ArabiaSenegalSerbiaSeychellesSierra LeoneSingaporeSlovak RepublicSloveniaSmall statesSolomon IslandsSomaliaSouth AfricaSouth AsiaSouth Asia (IDA & IBRD)SpainSri LankaSt. Kitts and NevisSt. LuciaSt. Vincent and the GrenadinesSub-Saharan Africa Sub-Saharan Africa (excluding high income)Sub-Saharan Africa (IDA & IBRD countries)SudanSurinameSwazilandSwedenSwitzerlandSyrian Arab RepublicTajikistanTanzaniaThailandTimor-LesteTogoTongaTrinidad and TobagoTunisiaTurkeyTurkmenistanTurks and Caicos IslandsTuvaluUgandaUkraineUnited Arab EmiratesUnited KingdomUnited StatesUpper middle incomeUruguayUzbekistanVanuatuVenezuela, RBVietnamVirgin Islands (U.S.)WorldYemen, Rep.ZambiaZimbabwe Timeline:
This timeline shows a graph from 1971 to 2009 of Belgium. No data until 1970. Number of actual observations by date: 39.
Source name:
World Development Indicators
Source organization:
World Bank staff estimates from original source: European Commission, Joint Research Centre (JRC)/Netherlands Environmental Assessment Agency (PBL). Emission Database for Global Atmospheric Research (EDGAR): http://edgar.jrc.ec.europa.eu/.
Categories, topics:
Agriculture & Rural Development, Environment
Last updated:
apr 23, 2017
Indicators value changes by year
Minimum:
21.424
jan 1, 1985
Maximum:
34.785
jan 1, 2004
At the date of observation
Value
Absolute change
Change from previous value
jan 1, 1971
26.442
+26.442
0.0%
jan 1, 1972
25.129
-1.314
-4.97%
jan 1, 1973
24.702
-0.427
-1.7%
jan 1, 1974
24.952
+0.251
1.02%
jan 1, 1975
22.655
-2.297
-9.21%
jan 1, 1976
26.886
+4.231
18.68%
jan 1, 1977
26.98
+0.094
0.35%
jan 1, 1978
24.044
-2.937
-10.88%
jan 1, 1979
23.232
-0.811
-3.37%
jan 1, 1980
23.226
-0.006
-0.03%
jan 1, 1981
22.981
-0.245
-1.05%
jan 1, 1982
22.337
-0.644
-2.8%
jan 1, 1983
23.764
+1.427
6.39%
jan 1, 1984
23.09
-0.675
-2.84%
jan 1, 1985
21.424
-1.666
-7.22%
jan 1, 1986
21.975
+0.552
2.57%
jan 1, 1987
22.81
+0.835
3.8%
jan 1, 1988
23.952
+1.142
5.01%
jan 1, 1989
25.123
+1.17
4.89%
jan 1, 1990
25.855
+0.732
2.91%
jan 1, 1991
33.632
+7.777
30.08%
jan 1, 1992
31.305
-2.327
-6.92%
jan 1, 1993
30.815
-0.489
-1.56%
jan 1, 1994
30.166
-0.649
-2.11%
jan 1, 1995
27.811
-2.355
-7.81%
jan 1, 1996
26.79
-1.021
-3.67%
jan 1, 1997
23.946
-2.844
-10.62%
jan 1, 1998
23.989
+0.043
0.18%
jan 1, 1999
24.188
+0.2
0.83%
jan 1, 2000
26.207
+2.018
8.34%
jan 1, 2001
26.642
+0.435
1.66%
jan 1, 2002
32.136
+5.494
20.62%
jan 1, 2003
32.338
+0.203
0.63%
jan 1, 2004
34.785
+2.447
7.57%
jan 1, 2005
34.478
-0.308
-0.88%
jan 1, 2006
33.354
-1.123
-3.26%
jan 1, 2007
32.797
-0.558
-1.67%
jan 1, 2008
31.609
-1.187
-3.62%
jan 1, 2009
31.347
-0.262
-0.83%
Ranking of countries by current statistics by years


Comments: