29
/
en
AIzaSyAYiBZKx7MnpbEhh9jyipgxe19OcubqV5w
April 1, 2024
249664
St. Kitts and Nevis
KNA
true
2
1
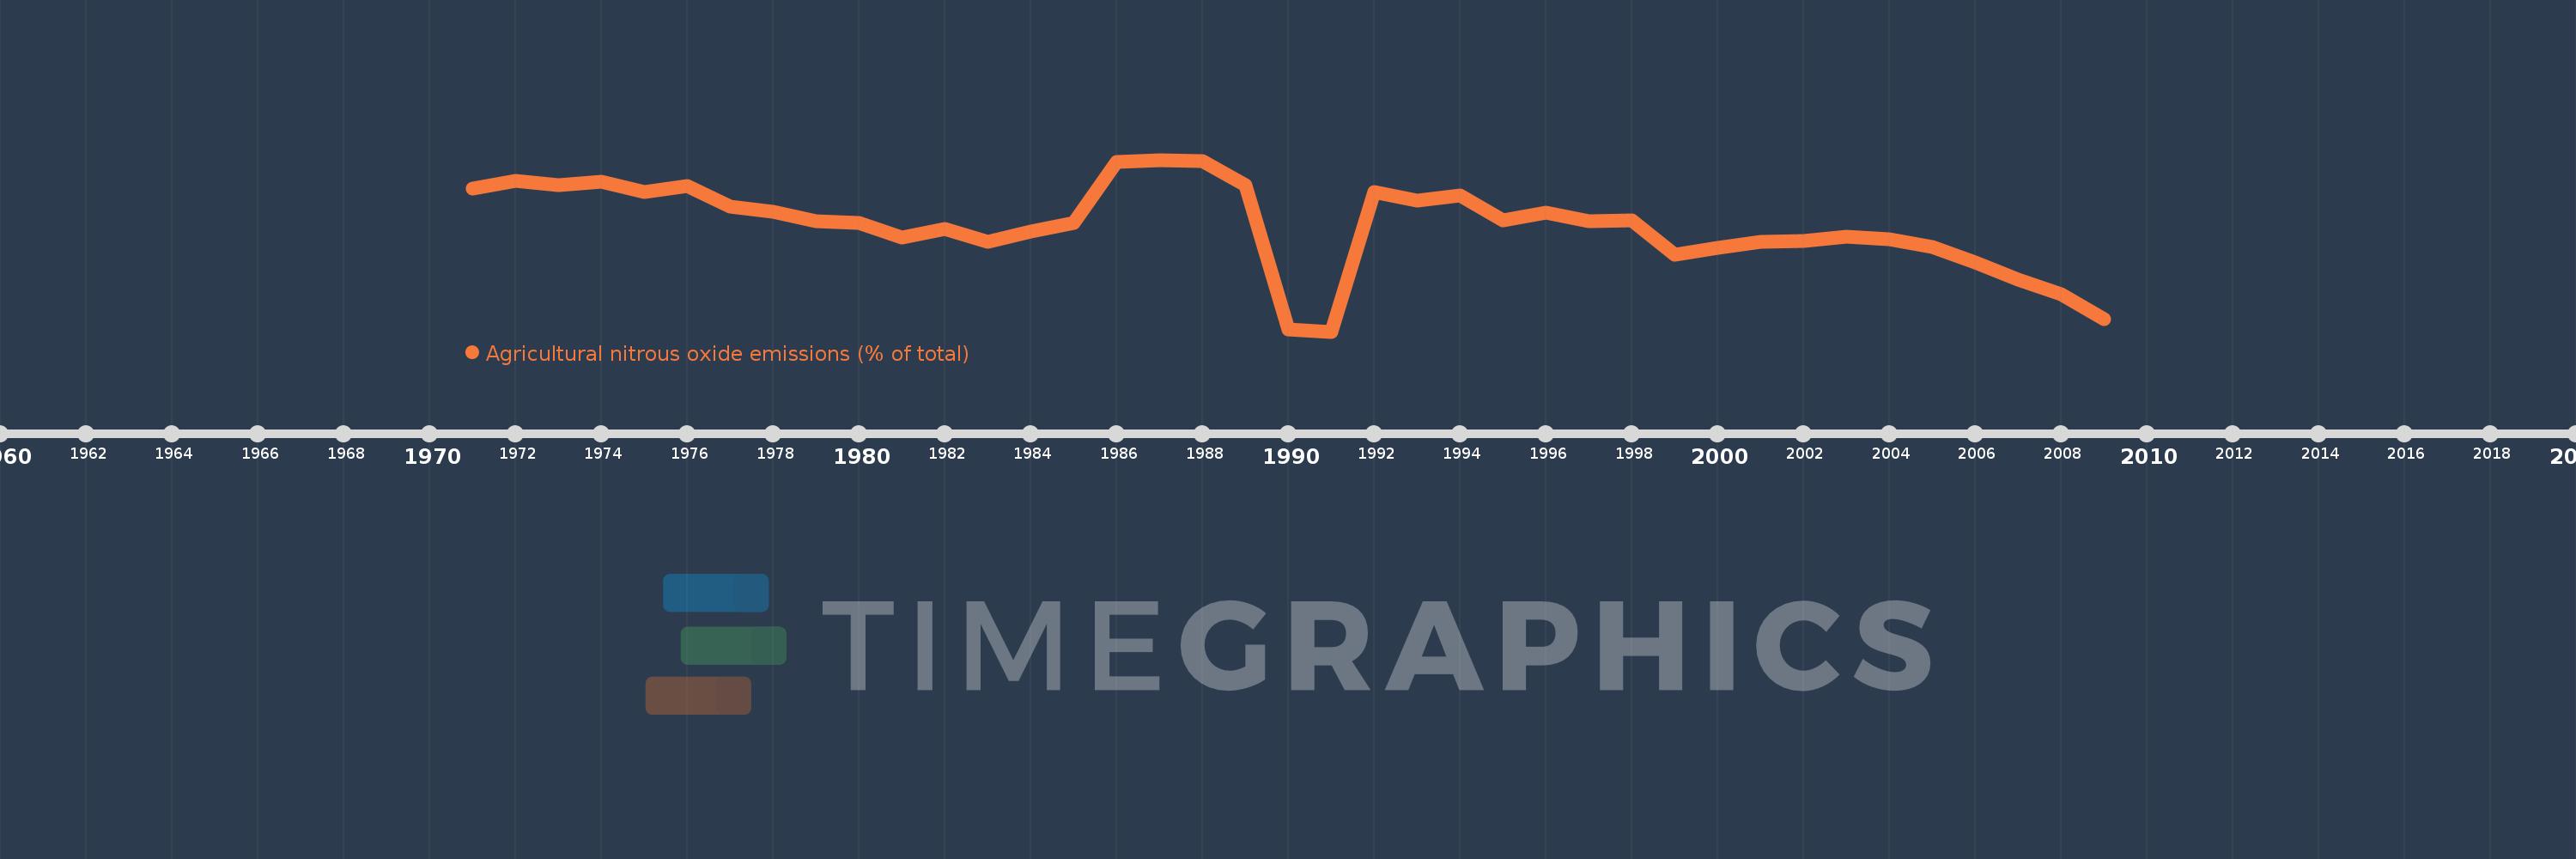
Agricultural nitrous oxide emissions (% of total)
2009,2008,2007,2006,2005,2004,2003,2002,2001,2000,1999,1998,1997,1996,1995,1994,1993,1992,1991,1990,1989,1988,1987,1986,1985,1984,1983,1982,1981,1980,1979,1978,1977,1976,1975,1974,1973,1972,1971
This statistics in other country:
AfghanistanAlbaniaAlgeriaAmerican SamoaAndorraAngolaAntigua and BarbudaArab WorldArgentinaArmeniaArubaAustraliaAustriaAzerbaijanBahamas, TheBahrainBangladeshBarbadosBelarusBelgiumBelizeBeninBermudaBhutanBoliviaBosnia and HerzegovinaBotswanaBrazilBritish Virgin IslandsBrunei DarussalamBulgariaBurkina FasoBurundiCabo VerdeCambodiaCameroonCanadaCaribbean small statesCayman IslandsCentral African RepublicCentral Europe and the BalticsChadChileChinaColombiaComorosCongo, Dem. Rep.Congo, Rep.Costa RicaCote d'IvoireCroatiaCubaCyprusCzech RepublicDenmarkDjiboutiDominicaDominican RepublicEarly-demographic dividendEast Asia & PacificEast Asia & Pacific (excluding high income)East Asia & Pacific (IDA & IBRD countries)EcuadorEgypt, Arab Rep.El SalvadorEquatorial GuineaEritreaEstoniaEthiopiaEuro areaEurope & Central AsiaEurope & Central Asia (excluding high income)Europe & Central Asia (IDA & IBRD countries)European UnionFaroe IslandsFijiFinlandFragile and conflict affected situationsFranceFrench PolynesiaGabonGambia, TheGeorgiaGermanyGhanaGibraltarGreeceGreenlandGrenadaGuamGuatemalaGuineaGuinea-BissauGuyanaHaitiHeavily indebted poor countries (HIPC)High incomeHondurasHong Kong SAR, ChinaHungaryIBRD onlyIcelandIDA & IBRD totalIDA blendIDA onlyIDA totalIndiaIndonesiaIran, Islamic Rep.IraqIrelandIsraelItalyJamaicaJapanJordanKazakhstanKenyaKiribatiKorea, Dem. People’s Rep.Korea, Rep.KuwaitKyrgyz RepublicLao PDRLate-demographic dividendLatin America & Caribbean Latin America & Caribbean (excluding high income)Latin America & the Caribbean (IDA & IBRD countries)LatviaLeast developed countries: UN classificationLebanonLesothoLiberiaLibyaLithuaniaLow & middle incomeLow incomeLower middle incomeLuxembourgMacao SAR, ChinaMacedonia, FYRMadagascarMalawiMalaysiaMaldivesMaliMaltaMarshall IslandsMauritaniaMauritiusMexicoMicronesia, Fed. Sts.Middle East & North AfricaMiddle East & North Africa (excluding high income)Middle East & North Africa (IDA & IBRD countries)Middle incomeMoldovaMongoliaMoroccoMozambiqueMyanmarNamibiaNauruNepalNetherlandsNew CaledoniaNew ZealandNicaraguaNigerNigeriaNorth AmericaNorthern Mariana IslandsNorwayOECD membersOmanOther small statesPacific island small statesPakistanPalauPanamaPapua New GuineaParaguayPeruPhilippinesPolandPortugalPost-demographic dividendPre-demographic dividendPuerto RicoQatarRomaniaRussian FederationRwandaSamoaSao Tome and PrincipeSaudi ArabiaSenegalSerbiaSeychellesSierra LeoneSingaporeSlovak RepublicSloveniaSmall statesSolomon IslandsSomaliaSouth AfricaSouth AsiaSouth Asia (IDA & IBRD)SpainSri LankaSt. Kitts and NevisSt. LuciaSt. Vincent and the GrenadinesSub-Saharan Africa Sub-Saharan Africa (excluding high income)Sub-Saharan Africa (IDA & IBRD countries)SudanSurinameSwazilandSwedenSwitzerlandSyrian Arab RepublicTajikistanTanzaniaThailandTimor-LesteTogoTongaTrinidad and TobagoTunisiaTurkeyTurkmenistanTurks and Caicos IslandsTuvaluUgandaUkraineUnited Arab EmiratesUnited KingdomUnited StatesUpper middle incomeUruguayUzbekistanVanuatuVenezuela, RBVietnamVirgin Islands (U.S.)WorldYemen, Rep.ZambiaZimbabwe Timeline:
This timeline shows a graph from 1971 to 2009 of St. Kitts and Nevis. No data until 1970. Number of actual observations by date: 39.
Source name:
World Development Indicators
Source organization:
World Bank staff estimates from original source: European Commission, Joint Research Centre (JRC)/Netherlands Environmental Assessment Agency (PBL). Emission Database for Global Atmospheric Research (EDGAR): http://edgar.jrc.ec.europa.eu/.
Categories, topics:
Agriculture & Rural Development, Environment
Last updated:
apr 23, 2017
Indicators value changes by year
Minimum:
62.374
jan 1, 1991
Maximum:
79.821
jan 1, 1987
At the date of observation
Value
Absolute change
Change from previous value
jan 1, 1971
76.926
+76.926
0.0%
jan 1, 1972
77.7
+0.774
1.01%
jan 1, 1973
77.287
-0.413
-0.53%
jan 1, 1974
77.603
+0.316
0.41%
jan 1, 1975
76.523
-1.08
-1.39%
jan 1, 1976
77.148
+0.626
0.82%
jan 1, 1977
75.068
-2.08
-2.7%
jan 1, 1978
74.572
-0.496
-0.66%
jan 1, 1979
73.551
-1.02
-1.37%
jan 1, 1980
73.367
-0.184
-0.25%
jan 1, 1981
71.943
-1.424
-1.94%
jan 1, 1982
72.796
+0.853
1.19%
jan 1, 1983
71.517
-1.279
-1.76%
jan 1, 1984
72.556
+1.039
1.45%
jan 1, 1985
73.392
+0.836
1.15%
jan 1, 1986
79.638
+6.246
8.51%
jan 1, 1987
79.821
+0.183
0.23%
jan 1, 1988
79.672
-0.149
-0.19%
jan 1, 1989
77.261
-2.411
-3.03%
jan 1, 1990
62.586
-14.675
-18.99%
jan 1, 1991
62.374
-0.211
-0.34%
jan 1, 1992
76.577
+14.202
22.77%
jan 1, 1993
75.667
-0.91
-1.19%
jan 1, 1994
76.229
+0.563
0.74%
jan 1, 1995
73.674
-2.555
-3.35%
jan 1, 1996
74.482
+0.807
1.1%
jan 1, 1997
73.556
-0.926
-1.24%
jan 1, 1998
73.699
+0.144
0.2%
jan 1, 1999
70.191
-3.508
-4.76%
jan 1, 2000
70.918
+0.727
1.04%
jan 1, 2001
71.498
+0.58
0.82%
jan 1, 2002
71.591
+0.094
0.13%
jan 1, 2003
72.048
+0.457
0.64%
jan 1, 2004
71.729
-0.319
-0.44%
jan 1, 2005
70.95
-0.779
-1.09%
jan 1, 2006
69.435
-1.515
-2.14%
jan 1, 2007
67.634
-1.801
-2.59%
jan 1, 2008
66.175
-1.459
-2.16%
jan 1, 2009
63.628
-2.547
-3.85%
Ranking of countries by current statistics by years


Comments: