29
/
en
AIzaSyAYiBZKx7MnpbEhh9jyipgxe19OcubqV5w
April 1, 2024
235343
Senegal
SEN
true
2
1
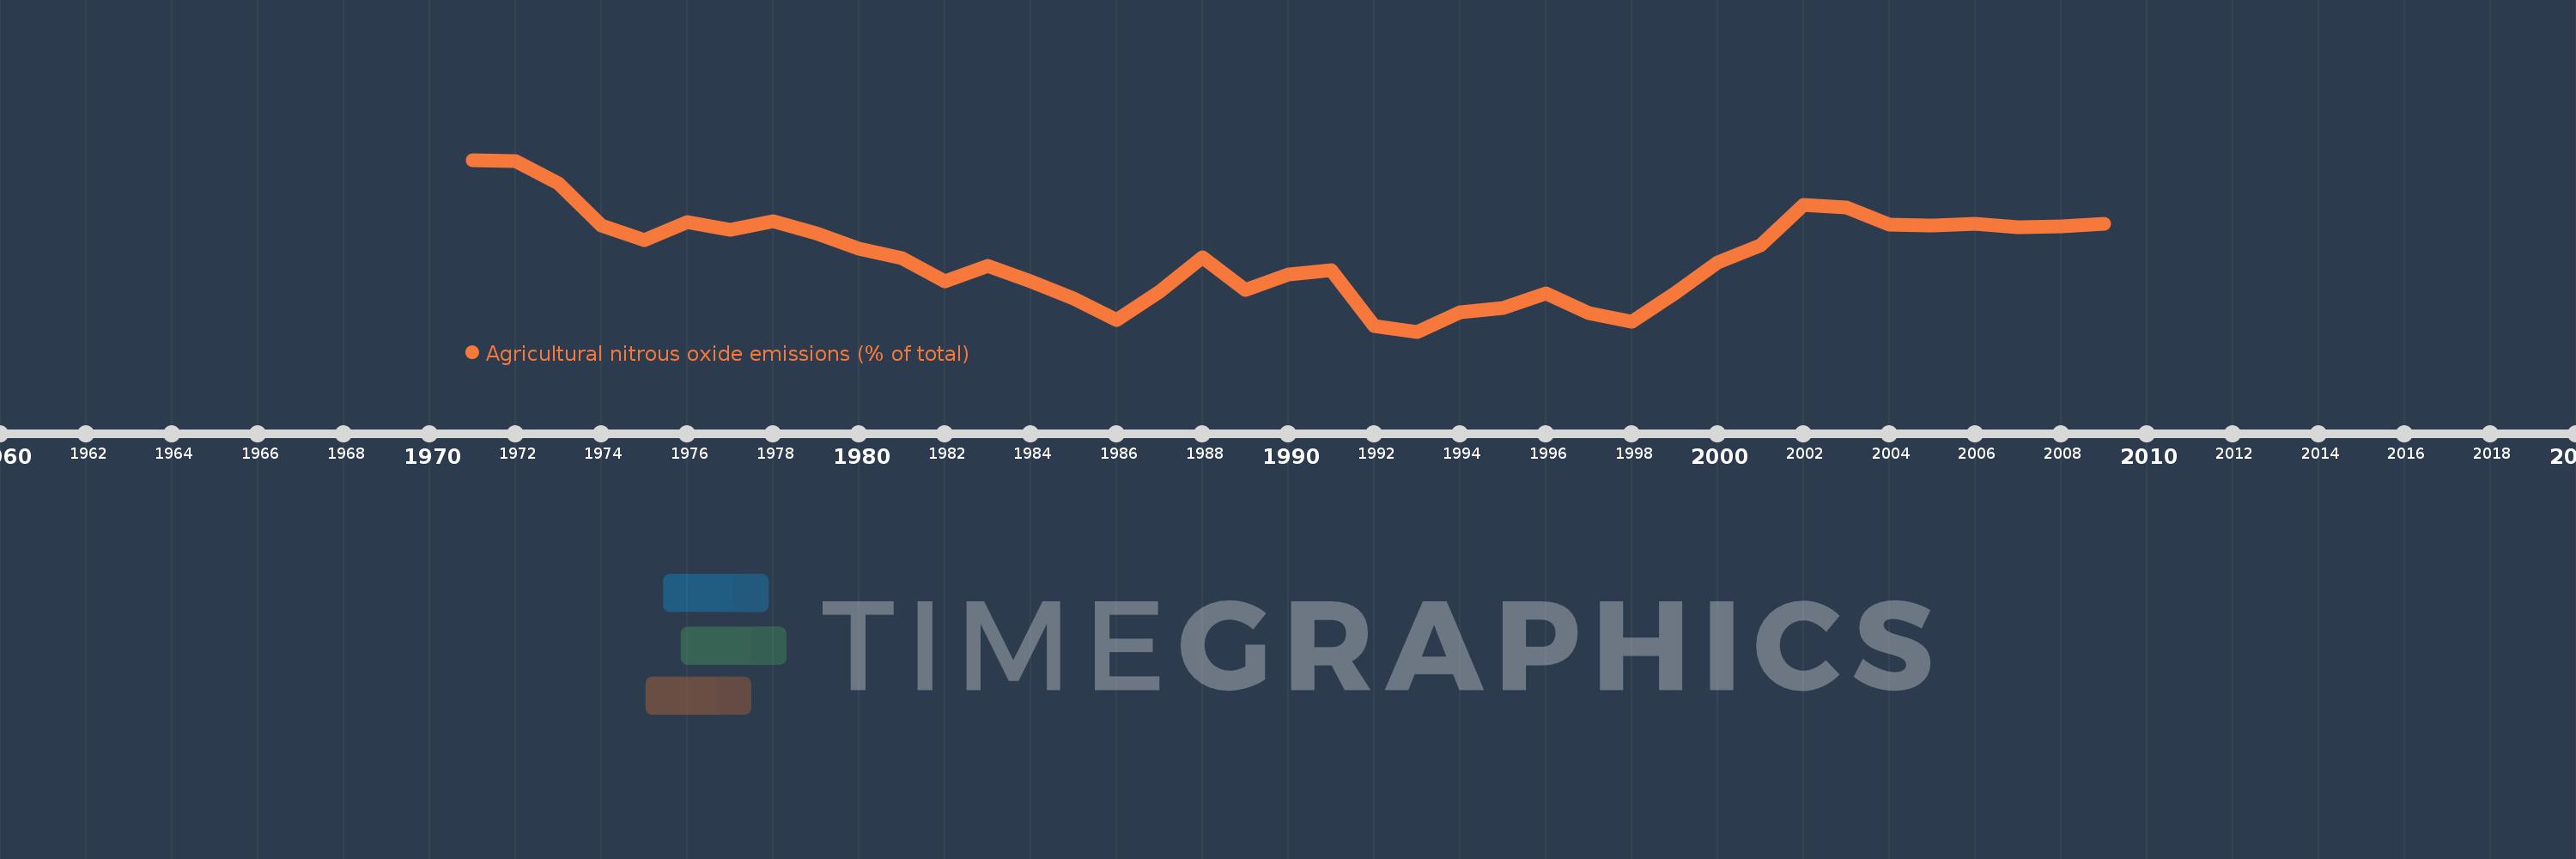
Agricultural nitrous oxide emissions (% of total)
2009,2008,2007,2006,2005,2004,2003,2002,2001,2000,1999,1998,1997,1996,1995,1994,1993,1992,1991,1990,1989,1988,1987,1986,1985,1984,1983,1982,1981,1980,1979,1978,1977,1976,1975,1974,1973,1972,1971
This statistics in other country:
AfghanistanAlbaniaAlgeriaAmerican SamoaAndorraAngolaAntigua and BarbudaArab WorldArgentinaArmeniaArubaAustraliaAustriaAzerbaijanBahamas, TheBahrainBangladeshBarbadosBelarusBelgiumBelizeBeninBermudaBhutanBoliviaBosnia and HerzegovinaBotswanaBrazilBritish Virgin IslandsBrunei DarussalamBulgariaBurkina FasoBurundiCabo VerdeCambodiaCameroonCanadaCaribbean small statesCayman IslandsCentral African RepublicCentral Europe and the BalticsChadChileChinaColombiaComorosCongo, Dem. Rep.Congo, Rep.Costa RicaCote d'IvoireCroatiaCubaCyprusCzech RepublicDenmarkDjiboutiDominicaDominican RepublicEarly-demographic dividendEast Asia & PacificEast Asia & Pacific (excluding high income)East Asia & Pacific (IDA & IBRD countries)EcuadorEgypt, Arab Rep.El SalvadorEquatorial GuineaEritreaEstoniaEthiopiaEuro areaEurope & Central AsiaEurope & Central Asia (excluding high income)Europe & Central Asia (IDA & IBRD countries)European UnionFaroe IslandsFijiFinlandFragile and conflict affected situationsFranceFrench PolynesiaGabonGambia, TheGeorgiaGermanyGhanaGibraltarGreeceGreenlandGrenadaGuamGuatemalaGuineaGuinea-BissauGuyanaHaitiHeavily indebted poor countries (HIPC)High incomeHondurasHong Kong SAR, ChinaHungaryIBRD onlyIcelandIDA & IBRD totalIDA blendIDA onlyIDA totalIndiaIndonesiaIran, Islamic Rep.IraqIrelandIsraelItalyJamaicaJapanJordanKazakhstanKenyaKiribatiKorea, Dem. People’s Rep.Korea, Rep.KuwaitKyrgyz RepublicLao PDRLate-demographic dividendLatin America & Caribbean Latin America & Caribbean (excluding high income)Latin America & the Caribbean (IDA & IBRD countries)LatviaLeast developed countries: UN classificationLebanonLesothoLiberiaLibyaLithuaniaLow & middle incomeLow incomeLower middle incomeLuxembourgMacao SAR, ChinaMacedonia, FYRMadagascarMalawiMalaysiaMaldivesMaliMaltaMarshall IslandsMauritaniaMauritiusMexicoMicronesia, Fed. Sts.Middle East & North AfricaMiddle East & North Africa (excluding high income)Middle East & North Africa (IDA & IBRD countries)Middle incomeMoldovaMongoliaMoroccoMozambiqueMyanmarNamibiaNauruNepalNetherlandsNew CaledoniaNew ZealandNicaraguaNigerNigeriaNorth AmericaNorthern Mariana IslandsNorwayOECD membersOmanOther small statesPacific island small statesPakistanPalauPanamaPapua New GuineaParaguayPeruPhilippinesPolandPortugalPost-demographic dividendPre-demographic dividendPuerto RicoQatarRomaniaRussian FederationRwandaSamoaSao Tome and PrincipeSaudi ArabiaSenegalSerbiaSeychellesSierra LeoneSingaporeSlovak RepublicSloveniaSmall statesSolomon IslandsSomaliaSouth AfricaSouth AsiaSouth Asia (IDA & IBRD)SpainSri LankaSt. Kitts and NevisSt. LuciaSt. Vincent and the GrenadinesSub-Saharan Africa Sub-Saharan Africa (excluding high income)Sub-Saharan Africa (IDA & IBRD countries)SudanSurinameSwazilandSwedenSwitzerlandSyrian Arab RepublicTajikistanTanzaniaThailandTimor-LesteTogoTongaTrinidad and TobagoTunisiaTurkeyTurkmenistanTurks and Caicos IslandsTuvaluUgandaUkraineUnited Arab EmiratesUnited KingdomUnited StatesUpper middle incomeUruguayUzbekistanVanuatuVenezuela, RBVietnamVirgin Islands (U.S.)WorldYemen, Rep.ZambiaZimbabwe Timeline:
This timeline shows a graph from 1971 to 2009 of Senegal. No data until 1970. Number of actual observations by date: 39.
Source name:
World Development Indicators
Source organization:
World Bank staff estimates from original source: European Commission, Joint Research Centre (JRC)/Netherlands Environmental Assessment Agency (PBL). Emission Database for Global Atmospheric Research (EDGAR): http://edgar.jrc.ec.europa.eu/.
Categories, topics:
Agriculture & Rural Development, Environment
Last updated:
apr 23, 2017
Indicators value changes by year
Minimum:
85.301
jan 1, 1993
At the date of observation
Value
Absolute change
Change from previous value
jan 1, 1971
89.41
+89.41
0.0%
jan 1, 1972
89.372
-0.037
-0.04%
jan 1, 1973
88.852
-0.521
-0.58%
jan 1, 1974
87.842
-1.01
-1.14%
jan 1, 1975
87.498
-0.344
-0.39%
jan 1, 1976
87.914
+0.417
0.48%
jan 1, 1977
87.731
-0.183
-0.21%
jan 1, 1978
87.942
+0.211
0.24%
jan 1, 1979
87.656
-0.286
-0.32%
jan 1, 1980
87.287
-0.37
-0.42%
jan 1, 1981
87.05
-0.236
-0.27%
jan 1, 1982
86.507
-0.543
-0.62%
jan 1, 1983
86.881
+0.374
0.43%
jan 1, 1984
86.502
-0.379
-0.44%
jan 1, 1985
86.09
-0.412
-0.48%
jan 1, 1986
85.571
-0.519
-0.6%
jan 1, 1987
86.263
+0.692
0.81%
jan 1, 1988
87.076
+0.813
0.94%
jan 1, 1989
86.303
-0.773
-0.89%
jan 1, 1990
86.66
+0.357
0.41%
jan 1, 1991
86.761
+0.101
0.12%
jan 1, 1992
85.433
-1.328
-1.53%
jan 1, 1993
85.301
-0.132
-0.15%
jan 1, 1994
85.769
+0.468
0.55%
jan 1, 1995
85.874
+0.105
0.12%
jan 1, 1996
86.216
+0.341
0.4%
jan 1, 1997
85.739
-0.476
-0.55%
jan 1, 1998
85.541
-0.198
-0.23%
jan 1, 1999
86.208
+0.667
0.78%
jan 1, 2000
86.954
+0.745
0.86%
jan 1, 2001
87.359
+0.406
0.47%
jan 1, 2002
88.325
+0.966
1.11%
jan 1, 2003
88.271
-0.054
-0.06%
jan 1, 2004
87.866
-0.404
-0.46%
jan 1, 2005
87.829
-0.038
-0.04%
jan 1, 2006
87.87
+0.042
0.05%
jan 1, 2007
87.795
-0.076
-0.09%
jan 1, 2008
87.818
+0.023
0.03%
jan 1, 2009
87.887
+0.07
0.08%
Ranking of countries by current statistics by years


Comments: