29
/
en
AIzaSyAYiBZKx7MnpbEhh9jyipgxe19OcubqV5w
April 1, 2024
240198
Singapore
SGP
true
2
1
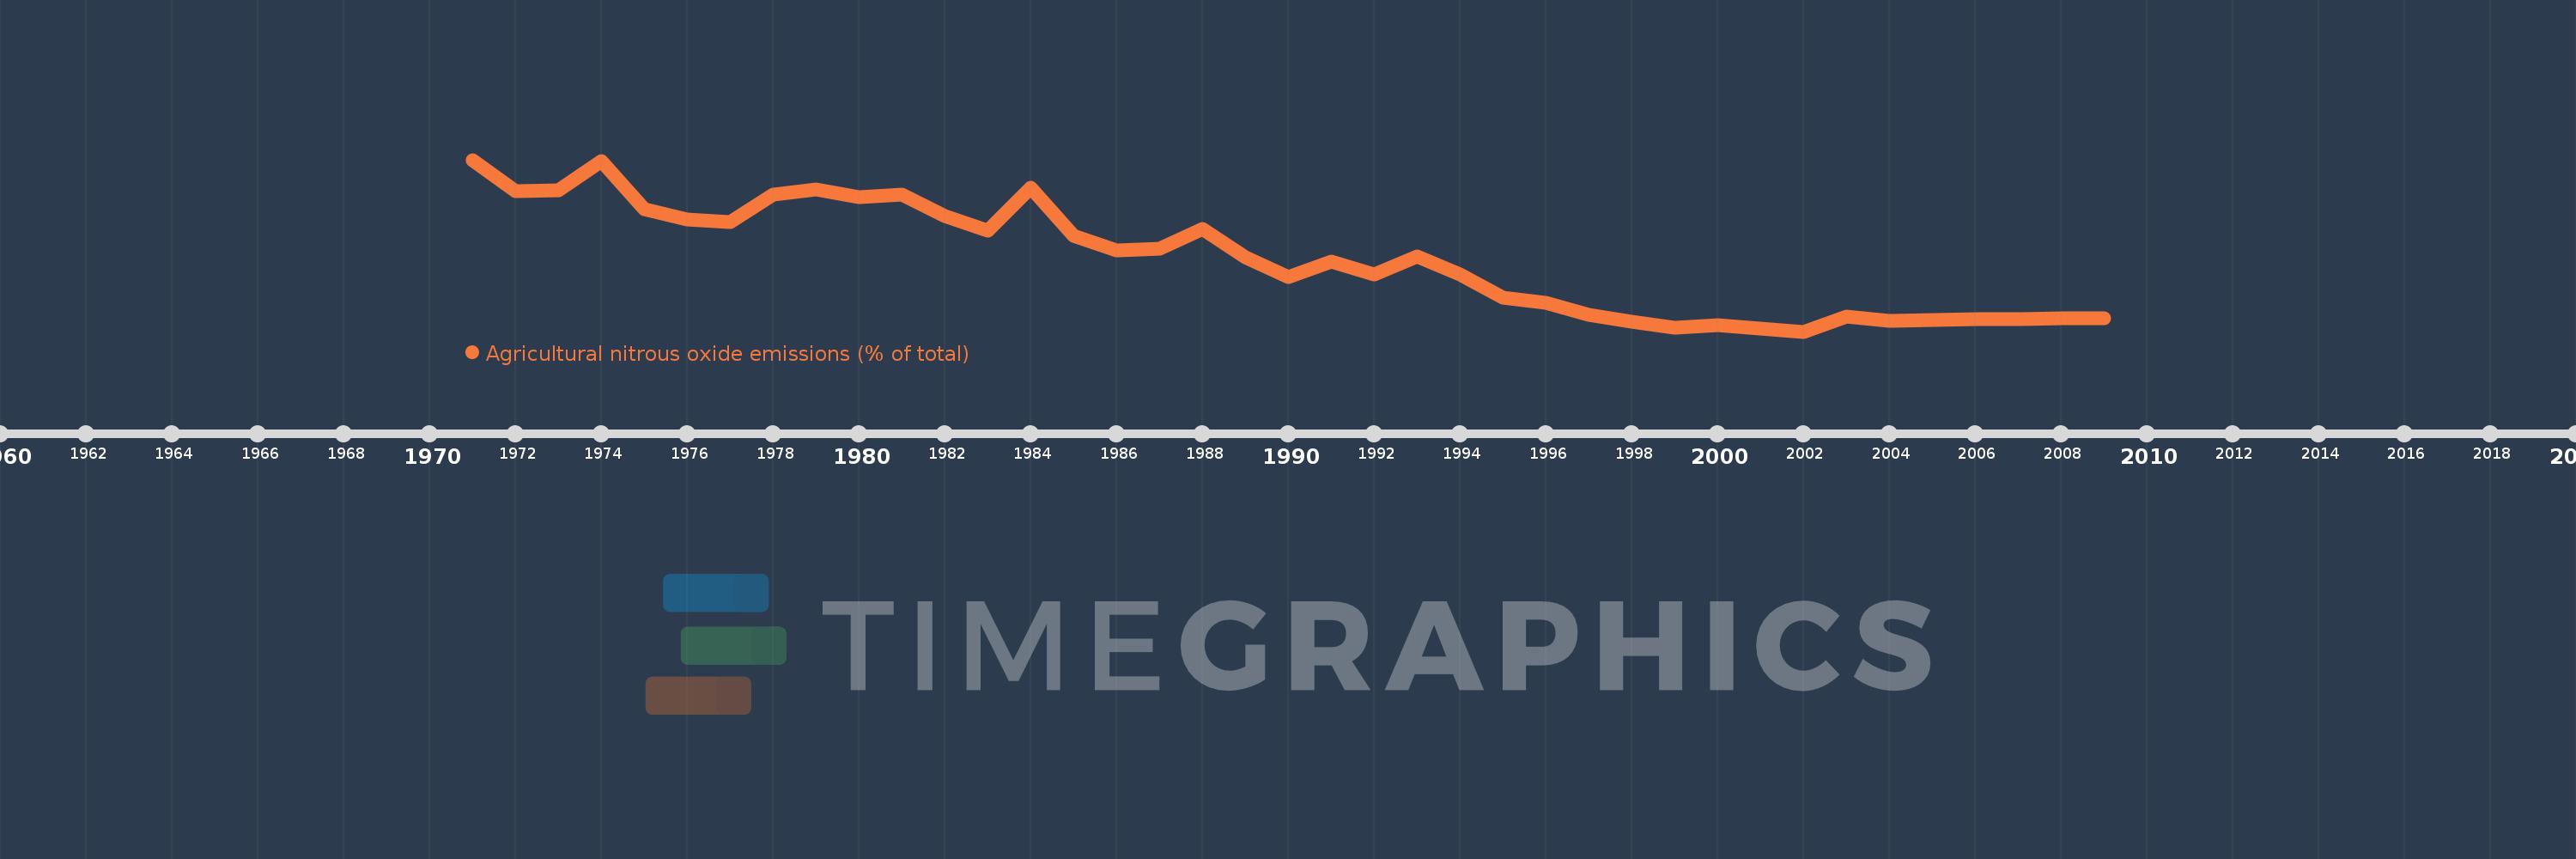
Agricultural nitrous oxide emissions (% of total)
2009,2008,2007,2006,2005,2004,2003,2002,2001,2000,1999,1998,1997,1996,1995,1994,1993,1992,1991,1990,1989,1988,1987,1986,1985,1984,1983,1982,1981,1980,1979,1978,1977,1976,1975,1974,1973,1972,1971
This statistics in other country:
AfghanistanAlbaniaAlgeriaAmerican SamoaAndorraAngolaAntigua and BarbudaArab WorldArgentinaArmeniaArubaAustraliaAustriaAzerbaijanBahamas, TheBahrainBangladeshBarbadosBelarusBelgiumBelizeBeninBermudaBhutanBoliviaBosnia and HerzegovinaBotswanaBrazilBritish Virgin IslandsBrunei DarussalamBulgariaBurkina FasoBurundiCabo VerdeCambodiaCameroonCanadaCaribbean small statesCayman IslandsCentral African RepublicCentral Europe and the BalticsChadChileChinaColombiaComorosCongo, Dem. Rep.Congo, Rep.Costa RicaCote d'IvoireCroatiaCubaCyprusCzech RepublicDenmarkDjiboutiDominicaDominican RepublicEarly-demographic dividendEast Asia & PacificEast Asia & Pacific (excluding high income)East Asia & Pacific (IDA & IBRD countries)EcuadorEgypt, Arab Rep.El SalvadorEquatorial GuineaEritreaEstoniaEthiopiaEuro areaEurope & Central AsiaEurope & Central Asia (excluding high income)Europe & Central Asia (IDA & IBRD countries)European UnionFaroe IslandsFijiFinlandFragile and conflict affected situationsFranceFrench PolynesiaGabonGambia, TheGeorgiaGermanyGhanaGibraltarGreeceGreenlandGrenadaGuamGuatemalaGuineaGuinea-BissauGuyanaHaitiHeavily indebted poor countries (HIPC)High incomeHondurasHong Kong SAR, ChinaHungaryIBRD onlyIcelandIDA & IBRD totalIDA blendIDA onlyIDA totalIndiaIndonesiaIran, Islamic Rep.IraqIrelandIsraelItalyJamaicaJapanJordanKazakhstanKenyaKiribatiKorea, Dem. People’s Rep.Korea, Rep.KuwaitKyrgyz RepublicLao PDRLate-demographic dividendLatin America & Caribbean Latin America & Caribbean (excluding high income)Latin America & the Caribbean (IDA & IBRD countries)LatviaLeast developed countries: UN classificationLebanonLesothoLiberiaLibyaLithuaniaLow & middle incomeLow incomeLower middle incomeLuxembourgMacao SAR, ChinaMacedonia, FYRMadagascarMalawiMalaysiaMaldivesMaliMaltaMarshall IslandsMauritaniaMauritiusMexicoMicronesia, Fed. Sts.Middle East & North AfricaMiddle East & North Africa (excluding high income)Middle East & North Africa (IDA & IBRD countries)Middle incomeMoldovaMongoliaMoroccoMozambiqueMyanmarNamibiaNauruNepalNetherlandsNew CaledoniaNew ZealandNicaraguaNigerNigeriaNorth AmericaNorthern Mariana IslandsNorwayOECD membersOmanOther small statesPacific island small statesPakistanPalauPanamaPapua New GuineaParaguayPeruPhilippinesPolandPortugalPost-demographic dividendPre-demographic dividendPuerto RicoQatarRomaniaRussian FederationRwandaSamoaSao Tome and PrincipeSaudi ArabiaSenegalSerbiaSeychellesSierra LeoneSingaporeSlovak RepublicSloveniaSmall statesSolomon IslandsSomaliaSouth AfricaSouth AsiaSouth Asia (IDA & IBRD)SpainSri LankaSt. Kitts and NevisSt. LuciaSt. Vincent and the GrenadinesSub-Saharan Africa Sub-Saharan Africa (excluding high income)Sub-Saharan Africa (IDA & IBRD countries)SudanSurinameSwazilandSwedenSwitzerlandSyrian Arab RepublicTajikistanTanzaniaThailandTimor-LesteTogoTongaTrinidad and TobagoTunisiaTurkeyTurkmenistanTurks and Caicos IslandsTuvaluUgandaUkraineUnited Arab EmiratesUnited KingdomUnited StatesUpper middle incomeUruguayUzbekistanVanuatuVenezuela, RBVietnamVirgin Islands (U.S.)WorldYemen, Rep.ZambiaZimbabwe Timeline:
This timeline shows a graph from 1971 to 2009 of Singapore. No data until 1970. Number of actual observations by date: 39.
Source name:
World Development Indicators
Source organization:
World Bank staff estimates from original source: European Commission, Joint Research Centre (JRC)/Netherlands Environmental Assessment Agency (PBL). Emission Database for Global Atmospheric Research (EDGAR): http://edgar.jrc.ec.europa.eu/.
Categories, topics:
Agriculture & Rural Development, Environment
Last updated:
apr 23, 2017
Indicators value changes by year
Maximum:
19.548
jan 1, 1971
At the date of observation
Value
Absolute change
Change from previous value
jan 1, 1971
19.548
+19.548
0.0%
jan 1, 1972
16.023
-3.525
-18.03%
jan 1, 1973
16.078
+0.056
0.35%
jan 1, 1974
19.379
+3.3
20.53%
jan 1, 1975
14.01
-5.369
-27.71%
jan 1, 1976
12.845
-1.165
-8.31%
jan 1, 1977
12.578
-0.267
-2.08%
jan 1, 1978
15.676
+3.098
24.63%
jan 1, 1979
16.209
+0.533
3.4%
jan 1, 1980
15.333
-0.876
-5.41%
jan 1, 1981
15.605
+0.272
1.78%
jan 1, 1982
13.28
-2.325
-14.9%
jan 1, 1983
11.547
-1.734
-13.05%
jan 1, 1984
16.373
+4.826
41.79%
jan 1, 1985
11.032
-5.341
-32.62%
jan 1, 1986
9.361
-1.67
-15.14%
jan 1, 1987
9.525
+0.163
1.74%
jan 1, 1988
11.765
+2.24
23.52%
jan 1, 1989
8.583
-3.182
-27.05%
jan 1, 1990
6.397
-2.185
-25.46%
jan 1, 1991
8.133
+1.736
27.14%
jan 1, 1992
6.651
-1.483
-18.23%
jan 1, 1993
8.738
+2.088
31.39%
jan 1, 1994
6.682
-2.056
-23.53%
jan 1, 1995
4.063
-2.619
-39.19%
jan 1, 1996
3.524
-0.539
-13.28%
jan 1, 1997
2.142
-1.382
-39.22%
jan 1, 1998
1.35
-0.791
-36.95%
jan 1, 1999
0.692
-0.658
-48.75%
jan 1, 2000
0.963
+0.271
39.15%
jan 1, 2001
0.611
-0.352
-36.55%
jan 1, 2002
0.262
-0.349
-57.13%
jan 1, 2003
1.903
+1.641
626.57%
jan 1, 2004
1.503
-0.4
-21.02%
jan 1, 2005
1.6
+0.097
6.47%
jan 1, 2006
1.626
+0.025
1.57%
jan 1, 2007
1.684
+0.058
3.58%
jan 1, 2008
1.713
+0.029
1.71%
jan 1, 2009
1.773
+0.06
3.53%
Ranking of countries by current statistics by years


Comments: