29
/
en
AIzaSyAYiBZKx7MnpbEhh9jyipgxe19OcubqV5w
April 1, 2024
128004
Eritrea
ERI
true
2
1
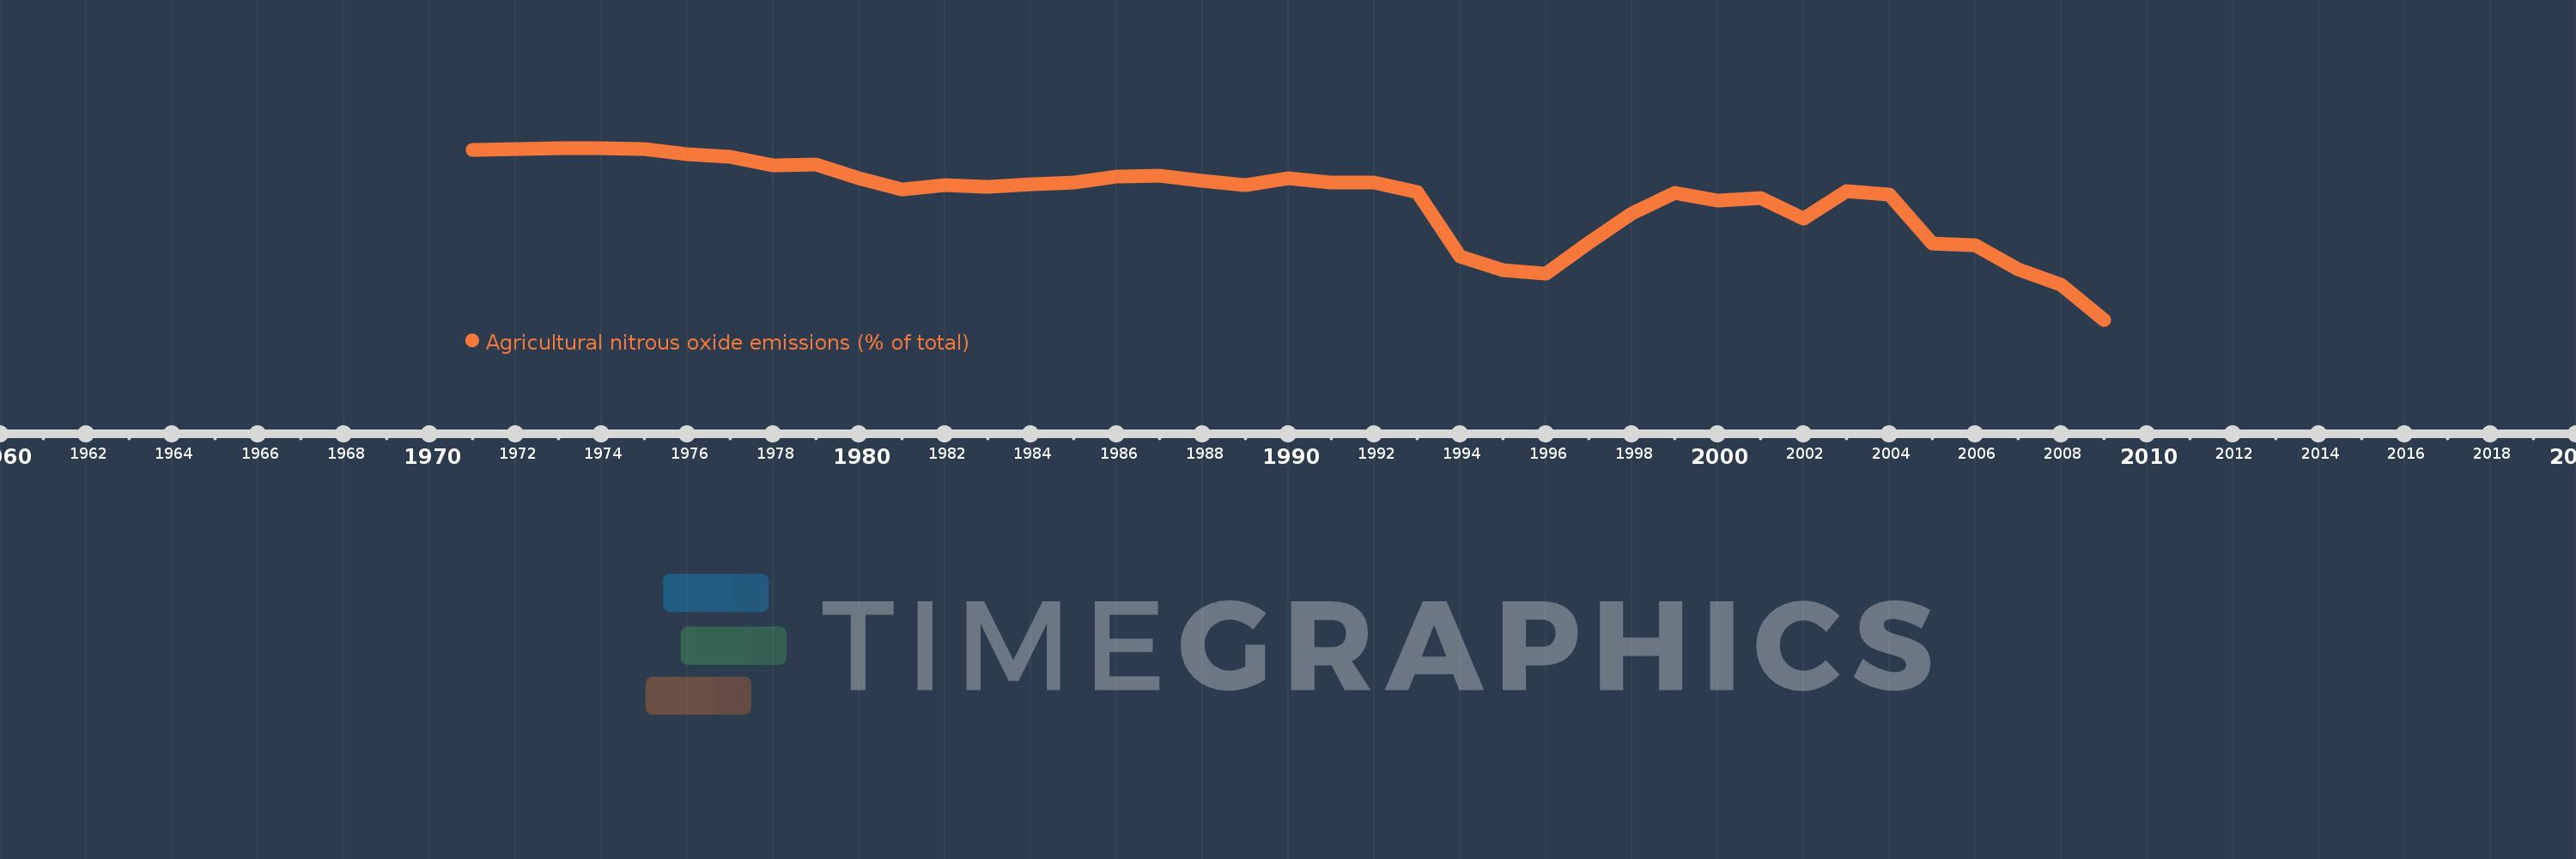
Agricultural nitrous oxide emissions (% of total)
2009,2008,2007,2006,2005,2004,2003,2002,2001,2000,1999,1998,1997,1996,1995,1994,1993,1992,1991,1990,1989,1988,1987,1986,1985,1984,1983,1982,1981,1980,1979,1978,1977,1976,1975,1974,1973,1972,1971
This statistics in other country:
AfghanistanAlbaniaAlgeriaAmerican SamoaAndorraAngolaAntigua and BarbudaArab WorldArgentinaArmeniaArubaAustraliaAustriaAzerbaijanBahamas, TheBahrainBangladeshBarbadosBelarusBelgiumBelizeBeninBermudaBhutanBoliviaBosnia and HerzegovinaBotswanaBrazilBritish Virgin IslandsBrunei DarussalamBulgariaBurkina FasoBurundiCabo VerdeCambodiaCameroonCanadaCaribbean small statesCayman IslandsCentral African RepublicCentral Europe and the BalticsChadChileChinaColombiaComorosCongo, Dem. Rep.Congo, Rep.Costa RicaCote d'IvoireCroatiaCubaCyprusCzech RepublicDenmarkDjiboutiDominicaDominican RepublicEarly-demographic dividendEast Asia & PacificEast Asia & Pacific (excluding high income)East Asia & Pacific (IDA & IBRD countries)EcuadorEgypt, Arab Rep.El SalvadorEquatorial GuineaEritreaEstoniaEthiopiaEuro areaEurope & Central AsiaEurope & Central Asia (excluding high income)Europe & Central Asia (IDA & IBRD countries)European UnionFaroe IslandsFijiFinlandFragile and conflict affected situationsFranceFrench PolynesiaGabonGambia, TheGeorgiaGermanyGhanaGibraltarGreeceGreenlandGrenadaGuamGuatemalaGuineaGuinea-BissauGuyanaHaitiHeavily indebted poor countries (HIPC)High incomeHondurasHong Kong SAR, ChinaHungaryIBRD onlyIcelandIDA & IBRD totalIDA blendIDA onlyIDA totalIndiaIndonesiaIran, Islamic Rep.IraqIrelandIsraelItalyJamaicaJapanJordanKazakhstanKenyaKiribatiKorea, Dem. People’s Rep.Korea, Rep.KuwaitKyrgyz RepublicLao PDRLate-demographic dividendLatin America & Caribbean Latin America & Caribbean (excluding high income)Latin America & the Caribbean (IDA & IBRD countries)LatviaLeast developed countries: UN classificationLebanonLesothoLiberiaLibyaLithuaniaLow & middle incomeLow incomeLower middle incomeLuxembourgMacao SAR, ChinaMacedonia, FYRMadagascarMalawiMalaysiaMaldivesMaliMaltaMarshall IslandsMauritaniaMauritiusMexicoMicronesia, Fed. Sts.Middle East & North AfricaMiddle East & North Africa (excluding high income)Middle East & North Africa (IDA & IBRD countries)Middle incomeMoldovaMongoliaMoroccoMozambiqueMyanmarNamibiaNauruNepalNetherlandsNew CaledoniaNew ZealandNicaraguaNigerNigeriaNorth AmericaNorthern Mariana IslandsNorwayOECD membersOmanOther small statesPacific island small statesPakistanPalauPanamaPapua New GuineaParaguayPeruPhilippinesPolandPortugalPost-demographic dividendPre-demographic dividendPuerto RicoQatarRomaniaRussian FederationRwandaSamoaSao Tome and PrincipeSaudi ArabiaSenegalSerbiaSeychellesSierra LeoneSingaporeSlovak RepublicSloveniaSmall statesSolomon IslandsSomaliaSouth AfricaSouth AsiaSouth Asia (IDA & IBRD)SpainSri LankaSt. Kitts and NevisSt. LuciaSt. Vincent and the GrenadinesSub-Saharan Africa Sub-Saharan Africa (excluding high income)Sub-Saharan Africa (IDA & IBRD countries)SudanSurinameSwazilandSwedenSwitzerlandSyrian Arab RepublicTajikistanTanzaniaThailandTimor-LesteTogoTongaTrinidad and TobagoTunisiaTurkeyTurkmenistanTurks and Caicos IslandsTuvaluUgandaUkraineUnited Arab EmiratesUnited KingdomUnited StatesUpper middle incomeUruguayUzbekistanVanuatuVenezuela, RBVietnamVirgin Islands (U.S.)WorldYemen, Rep.ZambiaZimbabwe Timeline:
This timeline shows a graph from 1971 to 2009 of Eritrea. No data until 1970. Number of actual observations by date: 39.
Source name:
World Development Indicators
Source organization:
World Bank staff estimates from original source: European Commission, Joint Research Centre (JRC)/Netherlands Environmental Assessment Agency (PBL). Emission Database for Global Atmospheric Research (EDGAR): http://edgar.jrc.ec.europa.eu/.
Categories, topics:
Agriculture & Rural Development, Environment
Last updated:
apr 23, 2017
Indicators value changes by year
Minimum:
88.297
jan 1, 2009
Maximum:
93.517
jan 1, 1974
At the date of observation
Value
Absolute change
Change from previous value
jan 1, 1971
93.464
+93.464
0.0%
jan 1, 1972
93.495
+0.031
0.03%
jan 1, 1973
93.503
+0.008
0.01%
jan 1, 1974
93.517
+0.015
0.02%
jan 1, 1975
93.483
-0.035
-0.04%
jan 1, 1976
93.317
-0.166
-0.18%
jan 1, 1977
93.248
-0.069
-0.07%
jan 1, 1978
92.988
-0.26
-0.28%
jan 1, 1979
93.004
+0.017
0.02%
jan 1, 1980
92.607
-0.397
-0.43%
jan 1, 1981
92.264
-0.343
-0.37%
jan 1, 1982
92.398
+0.134
0.15%
jan 1, 1983
92.341
-0.057
-0.06%
jan 1, 1984
92.418
+0.078
0.08%
jan 1, 1985
92.459
+0.041
0.04%
jan 1, 1986
92.651
+0.192
0.21%
jan 1, 1987
92.669
+0.018
0.02%
jan 1, 1988
92.518
-0.151
-0.16%
jan 1, 1989
92.385
-0.133
-0.14%
jan 1, 1990
92.596
+0.211
0.23%
jan 1, 1991
92.471
-0.125
-0.14%
jan 1, 1992
92.465
-0.006
-0.01%
jan 1, 1993
92.172
-0.293
-0.32%
jan 1, 1994
90.221
-1.95
-2.12%
jan 1, 1995
89.801
-0.421
-0.47%
jan 1, 1996
89.694
-0.107
-0.12%
jan 1, 1997
90.63
+0.936
1.04%
jan 1, 1998
91.519
+0.889
0.98%
jan 1, 1999
92.151
+0.632
0.69%
jan 1, 2000
91.913
-0.238
-0.26%
jan 1, 2001
91.989
+0.076
0.08%
jan 1, 2002
91.37
-0.619
-0.67%
jan 1, 2003
92.217
+0.848
0.93%
jan 1, 2004
92.11
-0.107
-0.12%
jan 1, 2005
90.6
-1.51
-1.64%
jan 1, 2006
90.564
-0.036
-0.04%
jan 1, 2007
89.841
-0.722
-0.8%
jan 1, 2008
89.362
-0.479
-0.53%
jan 1, 2009
88.297
-1.065
-1.19%
Ranking of countries by current statistics by years


Comments: