29
/
en
AIzaSyAYiBZKx7MnpbEhh9jyipgxe19OcubqV5w
April 1, 2024
94479
Burkina Faso
BFA
true
2
1
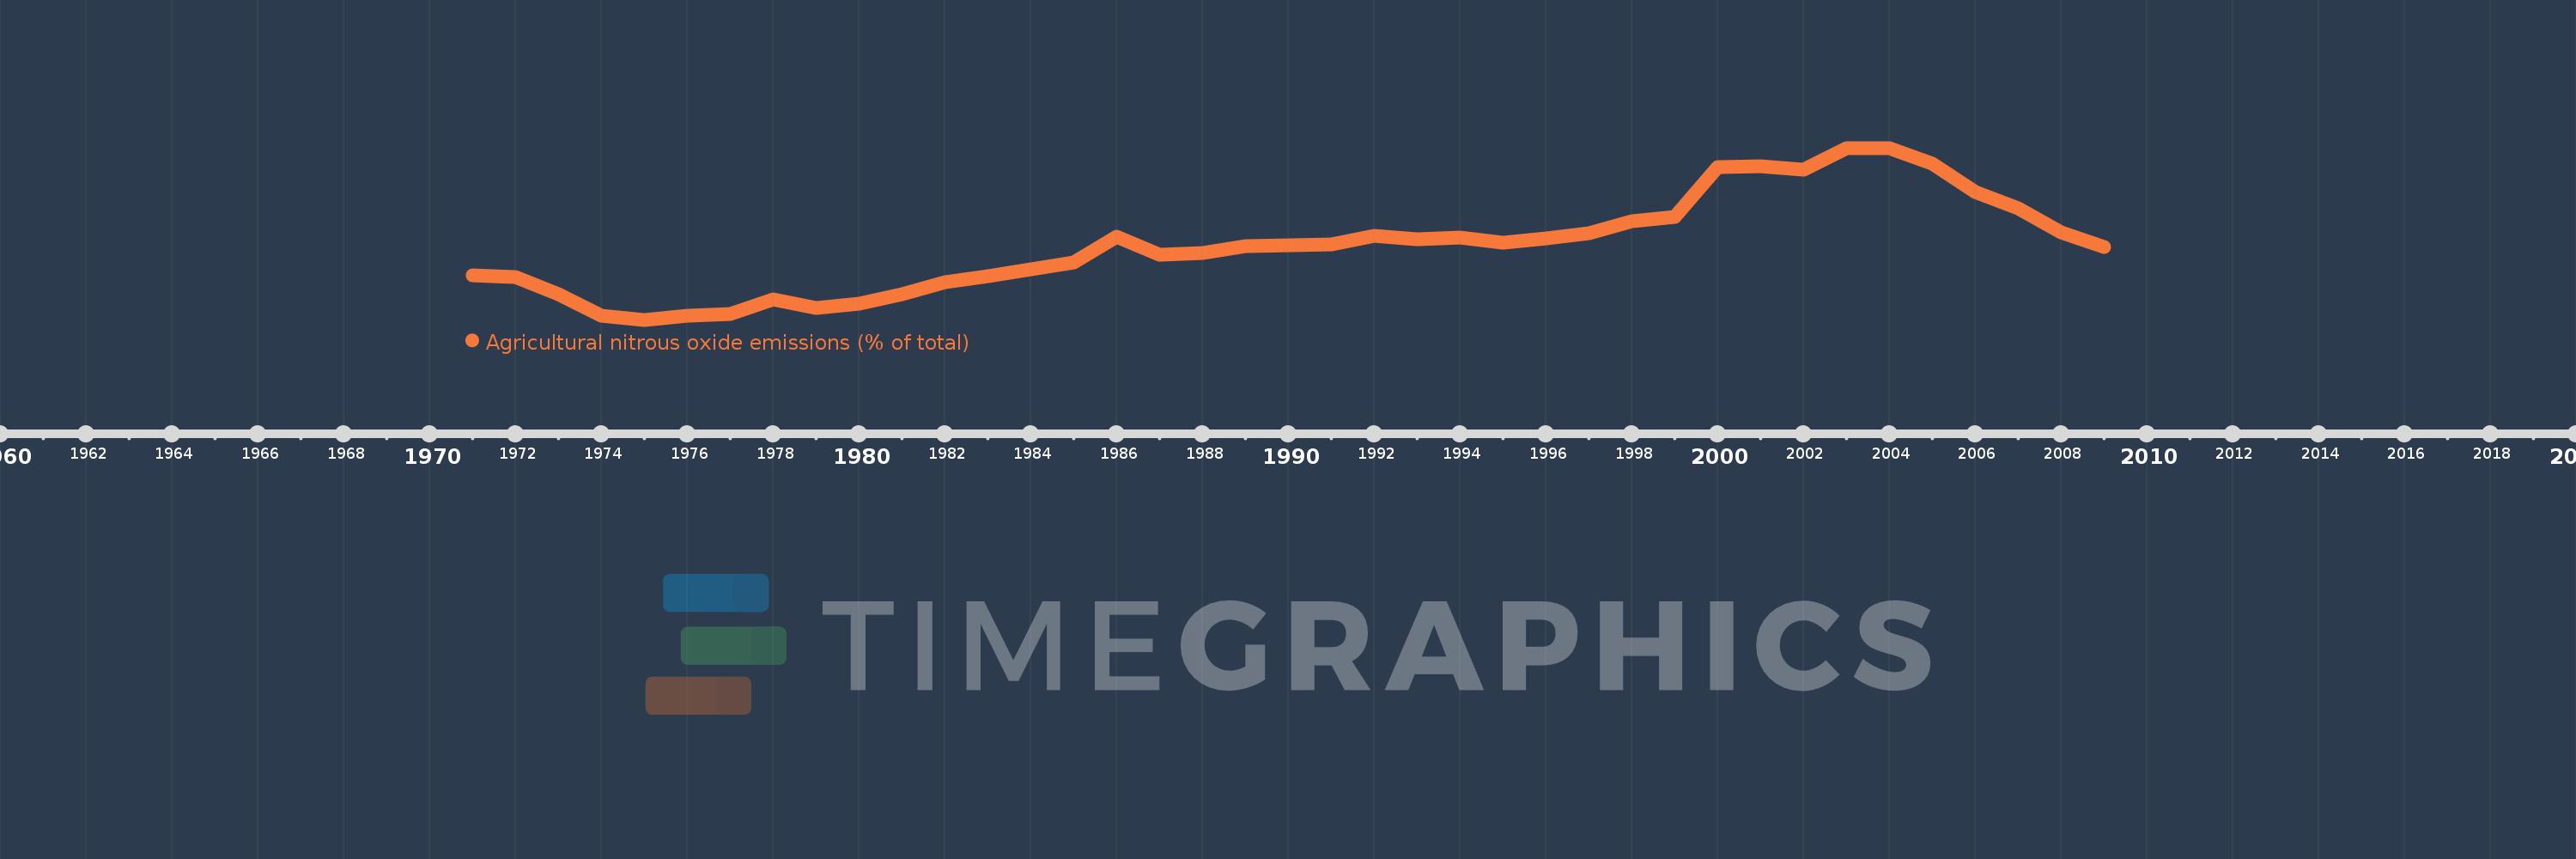
Agricultural nitrous oxide emissions (% of total)
2009,2008,2007,2006,2005,2004,2003,2002,2001,2000,1999,1998,1997,1996,1995,1994,1993,1992,1991,1990,1989,1988,1987,1986,1985,1984,1983,1982,1981,1980,1979,1978,1977,1976,1975,1974,1973,1972,1971
This statistics in other country:
AfghanistanAlbaniaAlgeriaAmerican SamoaAndorraAngolaAntigua and BarbudaArab WorldArgentinaArmeniaArubaAustraliaAustriaAzerbaijanBahamas, TheBahrainBangladeshBarbadosBelarusBelgiumBelizeBeninBermudaBhutanBoliviaBosnia and HerzegovinaBotswanaBrazilBritish Virgin IslandsBrunei DarussalamBulgariaBurkina FasoBurundiCabo VerdeCambodiaCameroonCanadaCaribbean small statesCayman IslandsCentral African RepublicCentral Europe and the BalticsChadChileChinaColombiaComorosCongo, Dem. Rep.Congo, Rep.Costa RicaCote d'IvoireCroatiaCubaCyprusCzech RepublicDenmarkDjiboutiDominicaDominican RepublicEarly-demographic dividendEast Asia & PacificEast Asia & Pacific (excluding high income)East Asia & Pacific (IDA & IBRD countries)EcuadorEgypt, Arab Rep.El SalvadorEquatorial GuineaEritreaEstoniaEthiopiaEuro areaEurope & Central AsiaEurope & Central Asia (excluding high income)Europe & Central Asia (IDA & IBRD countries)European UnionFaroe IslandsFijiFinlandFragile and conflict affected situationsFranceFrench PolynesiaGabonGambia, TheGeorgiaGermanyGhanaGibraltarGreeceGreenlandGrenadaGuamGuatemalaGuineaGuinea-BissauGuyanaHaitiHeavily indebted poor countries (HIPC)High incomeHondurasHong Kong SAR, ChinaHungaryIBRD onlyIcelandIDA & IBRD totalIDA blendIDA onlyIDA totalIndiaIndonesiaIran, Islamic Rep.IraqIrelandIsraelItalyJamaicaJapanJordanKazakhstanKenyaKiribatiKorea, Dem. People’s Rep.Korea, Rep.KuwaitKyrgyz RepublicLao PDRLate-demographic dividendLatin America & Caribbean Latin America & Caribbean (excluding high income)Latin America & the Caribbean (IDA & IBRD countries)LatviaLeast developed countries: UN classificationLebanonLesothoLiberiaLibyaLithuaniaLow & middle incomeLow incomeLower middle incomeLuxembourgMacao SAR, ChinaMacedonia, FYRMadagascarMalawiMalaysiaMaldivesMaliMaltaMarshall IslandsMauritaniaMauritiusMexicoMicronesia, Fed. Sts.Middle East & North AfricaMiddle East & North Africa (excluding high income)Middle East & North Africa (IDA & IBRD countries)Middle incomeMoldovaMongoliaMoroccoMozambiqueMyanmarNamibiaNauruNepalNetherlandsNew CaledoniaNew ZealandNicaraguaNigerNigeriaNorth AmericaNorthern Mariana IslandsNorwayOECD membersOmanOther small statesPacific island small statesPakistanPalauPanamaPapua New GuineaParaguayPeruPhilippinesPolandPortugalPost-demographic dividendPre-demographic dividendPuerto RicoQatarRomaniaRussian FederationRwandaSamoaSao Tome and PrincipeSaudi ArabiaSenegalSerbiaSeychellesSierra LeoneSingaporeSlovak RepublicSloveniaSmall statesSolomon IslandsSomaliaSouth AfricaSouth AsiaSouth Asia (IDA & IBRD)SpainSri LankaSt. Kitts and NevisSt. LuciaSt. Vincent and the GrenadinesSub-Saharan Africa Sub-Saharan Africa (excluding high income)Sub-Saharan Africa (IDA & IBRD countries)SudanSurinameSwazilandSwedenSwitzerlandSyrian Arab RepublicTajikistanTanzaniaThailandTimor-LesteTogoTongaTrinidad and TobagoTunisiaTurkeyTurkmenistanTurks and Caicos IslandsTuvaluUgandaUkraineUnited Arab EmiratesUnited KingdomUnited StatesUpper middle incomeUruguayUzbekistanVanuatuVenezuela, RBVietnamVirgin Islands (U.S.)WorldYemen, Rep.ZambiaZimbabwe Timeline:
This timeline shows a graph from 1971 to 2009 of Burkina Faso. No data until 1970. Number of actual observations by date: 39.
Source name:
World Development Indicators
Source organization:
World Bank staff estimates from original source: European Commission, Joint Research Centre (JRC)/Netherlands Environmental Assessment Agency (PBL). Emission Database for Global Atmospheric Research (EDGAR): http://edgar.jrc.ec.europa.eu/.
Categories, topics:
Agriculture & Rural Development, Environment
Last updated:
apr 23, 2017
Indicators value changes by year
Maximum:
91.906
jan 1, 2004
At the date of observation
Value
Absolute change
Change from previous value
jan 1, 1971
88.776
+88.776
0.0%
jan 1, 1972
88.724
-0.052
-0.06%
jan 1, 1973
88.312
-0.412
-0.46%
jan 1, 1974
87.775
-0.537
-0.61%
jan 1, 1975
87.68
-0.095
-0.11%
jan 1, 1976
87.782
+0.103
0.12%
jan 1, 1977
87.826
+0.044
0.05%
jan 1, 1978
88.19
+0.364
0.41%
jan 1, 1979
87.974
-0.215
-0.24%
jan 1, 1980
88.07
+0.095
0.11%
jan 1, 1981
88.317
+0.248
0.28%
jan 1, 1982
88.601
+0.284
0.32%
jan 1, 1983
88.754
+0.154
0.17%
jan 1, 1984
88.917
+0.162
0.18%
jan 1, 1985
89.083
+0.166
0.19%
jan 1, 1986
89.722
+0.639
0.72%
jan 1, 1987
89.273
-0.449
-0.5%
jan 1, 1988
89.323
+0.05
0.06%
jan 1, 1989
89.483
+0.159
0.18%
jan 1, 1990
89.508
+0.025
0.03%
jan 1, 1991
89.536
+0.028
0.03%
jan 1, 1992
89.737
+0.201
0.22%
jan 1, 1993
89.662
-0.075
-0.08%
jan 1, 1994
89.709
+0.047
0.05%
jan 1, 1995
89.585
-0.124
-0.14%
jan 1, 1996
89.676
+0.091
0.1%
jan 1, 1997
89.818
+0.142
0.16%
jan 1, 1998
90.103
+0.284
0.32%
jan 1, 1999
90.204
+0.101
0.11%
jan 1, 2000
91.442
+1.238
1.37%
jan 1, 2001
91.454
+0.012
0.01%
jan 1, 2002
91.364
-0.09
-0.1%
jan 1, 2003
91.905
+0.541
0.59%
jan 1, 2004
91.906
+0.001
0.0%
jan 1, 2005
91.522
-0.385
-0.42%
jan 1, 2006
90.817
-0.705
-0.77%
jan 1, 2007
90.417
-0.4
-0.44%
jan 1, 2008
89.83
-0.587
-0.65%
jan 1, 2009
89.47
-0.36
-0.4%
Ranking of countries by current statistics by years


Comments: