29
/
en
AIzaSyAYiBZKx7MnpbEhh9jyipgxe19OcubqV5w
April 1, 2024
142706
Grenada
GRD
true
2
1
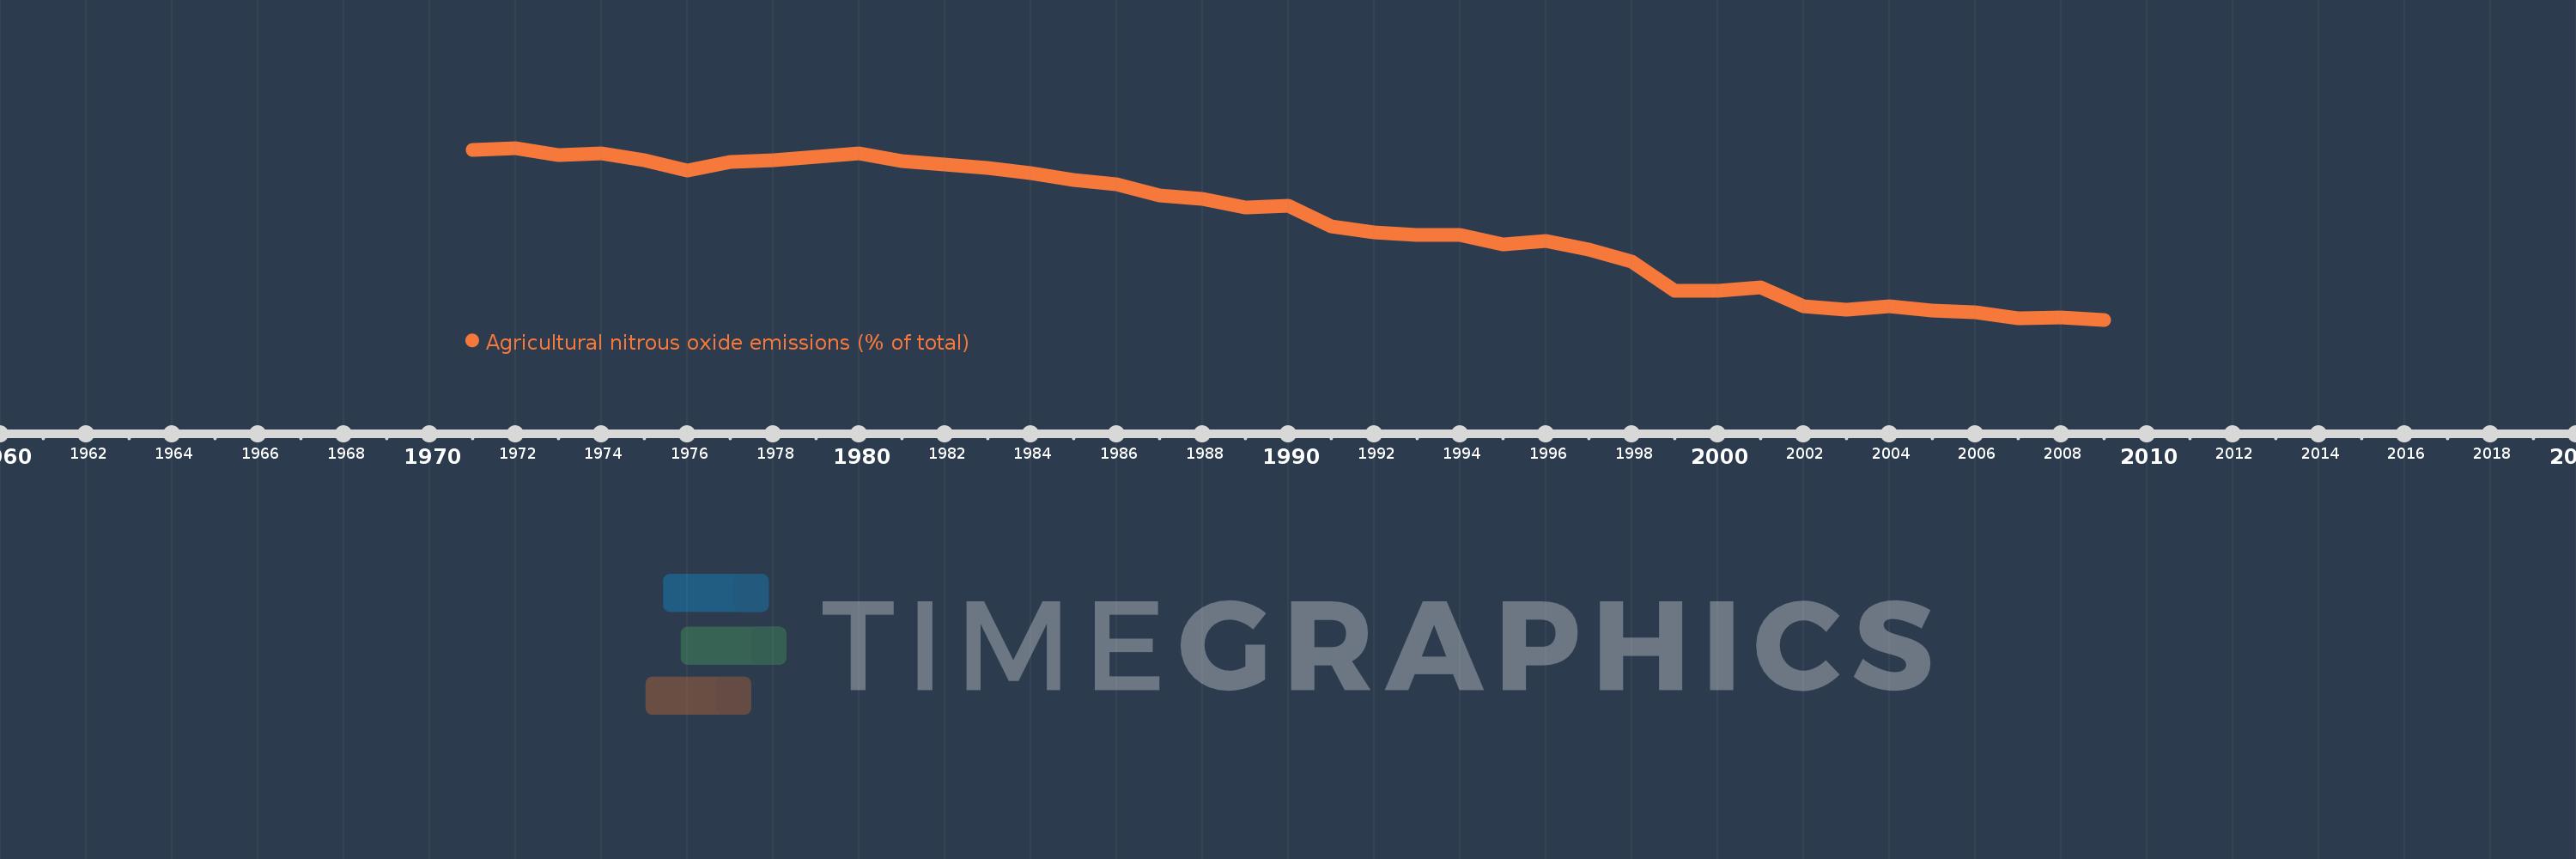
Agricultural nitrous oxide emissions (% of total)
2009,2008,2007,2006,2005,2004,2003,2002,2001,2000,1999,1998,1997,1996,1995,1994,1993,1992,1991,1990,1989,1988,1987,1986,1985,1984,1983,1982,1981,1980,1979,1978,1977,1976,1975,1974,1973,1972,1971
This statistics in other country:
AfghanistanAlbaniaAlgeriaAmerican SamoaAndorraAngolaAntigua and BarbudaArab WorldArgentinaArmeniaArubaAustraliaAustriaAzerbaijanBahamas, TheBahrainBangladeshBarbadosBelarusBelgiumBelizeBeninBermudaBhutanBoliviaBosnia and HerzegovinaBotswanaBrazilBritish Virgin IslandsBrunei DarussalamBulgariaBurkina FasoBurundiCabo VerdeCambodiaCameroonCanadaCaribbean small statesCayman IslandsCentral African RepublicCentral Europe and the BalticsChadChileChinaColombiaComorosCongo, Dem. Rep.Congo, Rep.Costa RicaCote d'IvoireCroatiaCubaCyprusCzech RepublicDenmarkDjiboutiDominicaDominican RepublicEarly-demographic dividendEast Asia & PacificEast Asia & Pacific (excluding high income)East Asia & Pacific (IDA & IBRD countries)EcuadorEgypt, Arab Rep.El SalvadorEquatorial GuineaEritreaEstoniaEthiopiaEuro areaEurope & Central AsiaEurope & Central Asia (excluding high income)Europe & Central Asia (IDA & IBRD countries)European UnionFaroe IslandsFijiFinlandFragile and conflict affected situationsFranceFrench PolynesiaGabonGambia, TheGeorgiaGermanyGhanaGibraltarGreeceGreenlandGrenadaGuamGuatemalaGuineaGuinea-BissauGuyanaHaitiHeavily indebted poor countries (HIPC)High incomeHondurasHong Kong SAR, ChinaHungaryIBRD onlyIcelandIDA & IBRD totalIDA blendIDA onlyIDA totalIndiaIndonesiaIran, Islamic Rep.IraqIrelandIsraelItalyJamaicaJapanJordanKazakhstanKenyaKiribatiKorea, Dem. People’s Rep.Korea, Rep.KuwaitKyrgyz RepublicLao PDRLate-demographic dividendLatin America & Caribbean Latin America & Caribbean (excluding high income)Latin America & the Caribbean (IDA & IBRD countries)LatviaLeast developed countries: UN classificationLebanonLesothoLiberiaLibyaLithuaniaLow & middle incomeLow incomeLower middle incomeLuxembourgMacao SAR, ChinaMacedonia, FYRMadagascarMalawiMalaysiaMaldivesMaliMaltaMarshall IslandsMauritaniaMauritiusMexicoMicronesia, Fed. Sts.Middle East & North AfricaMiddle East & North Africa (excluding high income)Middle East & North Africa (IDA & IBRD countries)Middle incomeMoldovaMongoliaMoroccoMozambiqueMyanmarNamibiaNauruNepalNetherlandsNew CaledoniaNew ZealandNicaraguaNigerNigeriaNorth AmericaNorthern Mariana IslandsNorwayOECD membersOmanOther small statesPacific island small statesPakistanPalauPanamaPapua New GuineaParaguayPeruPhilippinesPolandPortugalPost-demographic dividendPre-demographic dividendPuerto RicoQatarRomaniaRussian FederationRwandaSamoaSao Tome and PrincipeSaudi ArabiaSenegalSerbiaSeychellesSierra LeoneSingaporeSlovak RepublicSloveniaSmall statesSolomon IslandsSomaliaSouth AfricaSouth AsiaSouth Asia (IDA & IBRD)SpainSri LankaSt. Kitts and NevisSt. LuciaSt. Vincent and the GrenadinesSub-Saharan Africa Sub-Saharan Africa (excluding high income)Sub-Saharan Africa (IDA & IBRD countries)SudanSurinameSwazilandSwedenSwitzerlandSyrian Arab RepublicTajikistanTanzaniaThailandTimor-LesteTogoTongaTrinidad and TobagoTunisiaTurkeyTurkmenistanTurks and Caicos IslandsTuvaluUgandaUkraineUnited Arab EmiratesUnited KingdomUnited StatesUpper middle incomeUruguayUzbekistanVanuatuVenezuela, RBVietnamVirgin Islands (U.S.)WorldYemen, Rep.ZambiaZimbabwe Timeline:
This timeline shows a graph from 1971 to 2009 of Grenada. No data until 1970. Number of actual observations by date: 39.
Source name:
World Development Indicators
Source organization:
World Bank staff estimates from original source: European Commission, Joint Research Centre (JRC)/Netherlands Environmental Assessment Agency (PBL). Emission Database for Global Atmospheric Research (EDGAR): http://edgar.jrc.ec.europa.eu/.
Categories, topics:
Agriculture & Rural Development, Environment
Last updated:
apr 23, 2017
Indicators value changes by year
Minimum:
20.965
jan 1, 2009
Maximum:
70.267
jan 1, 1972
At the date of observation
Value
Absolute change
Change from previous value
jan 1, 1971
69.811
+69.811
0.0%
jan 1, 1972
70.267
+0.456
0.65%
jan 1, 1973
68.252
-2.014
-2.87%
jan 1, 1974
68.701
+0.448
0.66%
jan 1, 1975
66.714
-1.987
-2.89%
jan 1, 1976
63.76
-2.954
-4.43%
jan 1, 1977
66.321
+2.561
4.02%
jan 1, 1978
66.857
+0.536
0.81%
jan 1, 1979
67.636
+0.78
1.17%
jan 1, 1980
68.673
+1.037
1.53%
jan 1, 1981
66.612
-2.061
-3.0%
jan 1, 1982
65.389
-1.223
-1.84%
jan 1, 1983
64.472
-0.916
-1.4%
jan 1, 1984
62.948
-1.524
-2.36%
jan 1, 1985
60.998
-1.95
-3.1%
jan 1, 1986
59.743
-1.255
-2.06%
jan 1, 1987
56.724
-3.02
-5.05%
jan 1, 1988
55.63
-1.094
-1.93%
jan 1, 1989
53.228
-2.402
-4.32%
jan 1, 1990
53.611
+0.383
0.72%
jan 1, 1991
47.816
-5.795
-10.81%
jan 1, 1992
46.065
-1.751
-3.66%
jan 1, 1993
45.402
-0.663
-1.44%
jan 1, 1994
45.387
-0.014
-0.03%
jan 1, 1995
42.615
-2.773
-6.11%
jan 1, 1996
43.689
+1.075
2.52%
jan 1, 1997
41.013
-2.676
-6.13%
jan 1, 1998
37.597
-3.416
-8.33%
jan 1, 1999
29.304
-8.292
-22.06%
jan 1, 2000
29.258
-0.046
-0.16%
jan 1, 2001
30.198
+0.94
3.21%
jan 1, 2002
24.804
-5.394
-17.86%
jan 1, 2003
23.846
-0.958
-3.86%
jan 1, 2004
24.847
+1.001
4.2%
jan 1, 2005
23.546
-1.301
-5.23%
jan 1, 2006
23.163
-0.384
-1.63%
jan 1, 2007
21.363
-1.8
-7.77%
jan 1, 2008
21.509
+0.146
0.68%
jan 1, 2009
20.965
-0.544
-2.53%
Ranking of countries by current statistics by years


Comments: